此文件來自 台灣畜產種原知識庫
https://agrkb.angrin.tlri.gov.tw
THE TAIWAN PIG PERFORMANCE ON-FARM TESTING PROGRAM:
CURRENT STATUS AND FUTURE DEVELOPMENT
TSOU, HUI-LIANG
Pig Research Institute, Taiwan
ABSTRACT
Current. Taiwan’s Pig Performance On-farm Testing Program including the evaluation of growth and reproduction performances began in 1980. Since then, over 17,000 heads (including 14,000 pure breeds) of pig were tested each year in this program.
This number is almost equal to one third of the pigs which should be tested in Taiwan. Selection indices were derived on the local economic situation.
Effects. Genetic change analysis revealed that before 1988 the avg. daily gain from birth (ADG) increased 10-30g, and the backfat (BF), except Landrace’s, declined 0.14-0.27mm every year. Indeed, Landrace pigs have improved tremendously for both ADG and BF traits in recent years.
Problems. Undesirable changes of the sows’ reproduction, bone structure, appetite, and meat quality have been criticized in recent years, as were breeding goals and parameter estimation biases.
Future. Several steps will be taken to redress undesirable changes and increase selection accuracy in the near future: such as to adopt combined selection indeices by breed/line, apply a soundness linear scoring system, use a mixed model statistics procedure, set and/or add new testing traits, adjust end-test weight, and enhance relationships with artificial insemination centers and other breeding programs.
INTRODUCTION
Performance testing is the main motivator to promote genetic improvement in pigs. Three pig performance testing programs have been adopted in Taiwan: Central Boar Performance Test Station, Central Progeny Test Station, and On-farm Testing Program (Fig.1). The pig performance on-farm testing program has been widely adopted by many pork-producing countries since the 1960’s, such as Ven Diper et al.(1989), Merks et al. (1988), Roberts et al. (1981) and Lindhe et al. (1980). Its main purposes are to increase the selection intensity of gilts and/or boars, assist breeders to proceed with their own breeding schemes and do comparison and selection between herds, reduce the cost of pig testing, and reduce the chance of disease transmission. The effects of this program have been confirmed by many countries during the last three decades.
The pig performance on - farm testing program in Taiwan was organized by )is. Yen and Dr. Chyr at Pig Research Institute of Taiwan(PRIT) in 1980. The number of annual on-farm tested pigs in recent years has increased to over 17,000 heads which was about one third of the total tested pigs on the whole island. In this paper I will review some of the aspects of the on-farm performance testing program and its changes, genetic improvement effects, problems in recent years, and steps which should be taken in the near future. The relationship of this program with other performance testing programs, and the comparison of on-farm testing and central testing systems will also be shown in this text.
DEVELOPMENT OF PERFORMANCE OF ON-FARM TESTING SYSTEMS IN TAIWAN
*Growth Performance Evaluation
Testing Procedure. The development of central testing and on-farm testing procedures is shown in Table 1. The on-farm testing program became operational in 1980. Small full-sib or paternal half - sib test group (less than ten), high protein diet (>17%), and stabilizing feeding system were suggested. The choice of this testing management and the pigs which were selected for test vere decided by farmers themselves. The end-test weight was designed to be 90kg for both sexes in the beginning, and was changed to 110 kg in 1979 and 1982 for central tested boars and on-fare tested pigs, respectively, due to the 20kg lag between backfat deposition of boars and barrows(Tsou, 1976).
Data Collecting. For the on-farm testing program, two technicians visited breeding farms once or twice per month to measure the ultrasonic backfat thickness (ultrasonic loineye depth was additionally taken beginning in 1992 for loineye evaluation) and to record body weight of pigs. The backfat and growth rate were corrected to a constant body weight by the following formulas before the calculation of selection index (Yen, 1986):
Adjusted age at standard body at. (AGE)
=Actual age +1.257' (Standard weight -Actual weight).
Adjusted daily gain from birth to standard body weight (ADG)
=(Standard weight-1) / (Adjusted age-l).
Adjusted backfat thickness at standard body wt. (BF)
=Actual backfat «[(Standard weight/ Actual weight)~~0.5].
Loineye area (LEA)
=10.36 *(ultrasonic loineye depth at last rib).
where, the standard body weights for female and male pigs are 90kg and 110 kg, respectively.
The estimated breeding value (EBV) of a boar from its progeny on-farm testing records was analyzed each year in order to identify the accuracy of selection (Fig. 2).
The pigs of the Central Boar Performance Test Station which began in 1975 were tested from 30kg to 90kg body weight. (Table 1). The animals mere penned individually and fed on a high protein (cp 17.6%) diet at full feeding scale. In 1979, the end-test weight whas changed to 110kg. Two-full-sib group test was adopted in 1982 due to the high incidence of testes injury in small individual pens. Individual avg. daily gain and fullsibs avg. feeds efficiency during the testing period and avg. ultrasonic backfat at end-test weight of individual were used to calculate testing boar’s selection index. In order to evaluate the progenies’ carcass traits of the central tested boars, the Central Progeny Test Station was constructed in the south of Taiwan at the Taiwan Livestock Research Institute, in 1989. A full-sib progeny unit which contains two boars and one gilt of a central tested boar was individually tested in this station. The gilt was slaughtered at the end of its performance test to collect carcass data.
Selection Index. In the beginning of operation, local phenotypic and genotypic parameters of tested traits were not available for central test boars and on-farm tests; therefore, the selection indices of the Iowa Swine Test Station and NLC index of the U.K. were first adopted, respectively. Chyr (1980) used the local economic value and parameters (Tables 2, 8) from foreign research papers to build new selection indices and applied them to both the boar test and on-farm test programs from 1981 and from 1982, respectively. In 1990, Taiwan index of the Central Boar Test Station were reevaluated for maternal breeds, Landrace and Yorkshire, and were modified for increasing ADG and reducing BF genetic improvement in order to diminish reproduction, bone structure problems and reduce production cost (Tsou, 1990b; Tsou,1991; Chang, 1990).
The relative economic values and percentage of expected economic peturn of tested traits of the indices used in Taiwan are shown and compared in Table 2. The economic weight value of backfat was not larger than for the other two traits. However, the percentage of expected economic return of backfat in predicated index gain was the highest one(61.7%)due to its higher heritability and positive correlation with feed efficiency. Affected selection indices of different test programs are as follows:
Central Boar Test Station:
1975-1980 I=250+110(ADG) -50(FE) -19.7(BF)
1981-1991 I=100+ 60(ADG-MADG)-40(FE-MFE)-45(BF-MBF)
1992- L,Y: I=100+130(ADG-MADG)-40(FE-MFE)-40(BF-MBF)
D: I=100+ 60(ADG-MADG)-40(FE-MFE)-45(BF-MBF)
On-farm test program:
1980-1982 I=100+242(ADG-MADG)-41.3(BF-MBF)
1982- I=100+180(ADG-MADG)-50 (BF-MBF)
MADG, MFE, and MBF represented the moving means of three months for traits of ADG, FE, and BF by farm, breed, and sex, respectively.
*Reproduction performance evaluation
A Sow Productivity Index (SPI) from U. S. National Swine Improvement Federation (NSIF, 1981) has been used to evaluate the on-farm reproductive performance of sows since 1985.
SPI= 6.5(LSO) +2.2(LW21 in kg.)
where LS0 was litter size at birth and LW21 was litter weight at 21 days adjusted for parity and number of nursing piglets.
To predict sows’ reproductive performance for culled undesirable saws and estimate their breeding value for progeny selection, new indices were derived by the path analysis method or traits added onto the SPI base (Tsou, 1989). Three kinds of these sow productivity indices were classified as shown in Table3.
TIME TRENDS OF PIG ON-FARM PERFORMANCES
*Change of the number of annual tested pigs
The number of on-farm tested pigs from 1980 to 1992 is shown in Table 4. Landrace (L), Duroc (D), and Yorkshire (Y) are the three main breeds of pig in Taiwan with more than 80% of the total. This fact indicates that a large part of slaughtered crossed hogs come from first cross of L´D and three breeds cross of L´Y or Y´L female with D sire.
*Change of phenotypic performances
Growth performances.
Raw means of avg. daily gain (ADG) and ultrasonic backfat (BF) of on-farm test gilts by breed and year are shown in Figure 3 and 4(Tsou et al., 1992). Large selection pressure has increased lean meat production since 1985. The yearly decline in backfat thickness was about 0.13, 0.1, and 0.07 cm for Landrace, Yorkshire, and Duroc, respectively. The rate of backfat reduction was highest in L in which the average backfat was nearly 1.0 cm in 1992. This large improvement was mainly due to the importation of thinner backfat and fast-growing Norway Landrace.
The avg. daily gain from birth of gilts increased quickly from 1980 to 1985, and it remained the same for all pigs except Landrace. In the past three years the ADG of Yorkshire, Duroc, Duroc, and Hampshire pigs seemed to decline.
However, when data before 1988 were adjusted by fixed effects of farm, year, season, their interactions, and end-test weight, the average annual phenotypic changes for ADG and BF both approached a desirable direction for every breed studied(Table 6). The results also revealed that Landrace had the largest annual phenotypic gains in both traits when compared to Yorkshire and Duroc.
Reproduction performance
Table 5 shows the mean reproductive traits by year and breed during 1987-1992. It indicates that Landrace had the highest average in all five reproductive traits. As many foreign reference papers show, Duroc had inferior reproductive performances when compared with the other two breeds. Litter size at birth varied among years but was arround the mean by breed. However, the litter size at 21 days decreased greatly after 1990. The survival rate at 21 days declined almost 15% for all three breeds during the past three years.
Complaints from farmers of weak legs, high replacement of gilts, and long heat return of sows after weaning also have increased in recent years. Skilled Labor shortage, appetite failure, disease problems, and thin backfat of sows are doubted to be the main causes of these problems. A total of 14,846 litter records from 11 farms were analyzed (Tsou, 1990a) to find the relationship between backfat thickness and reproduction traits. If the backfat thickness of gilts was allocated into four groups (<1.0, 1.5, 2.0, >2.5cm), it was found that the first farrowing age of gilts, litter size at birth, and litter size and litter weight at 21 days were all significantly inferior when backfat was less than 1.0 cm. The highest annual replacement rate (35.9%) was found in Landrace due to undesirable bone structure. It seems that leg weakness is correlated with the backfat thickness.
*Genetic change of on-farm performances
The Smith’s (1962) within-sire regression on year method was used to evaluate the genetic change of on-farm performances from 1980 to 1988(Tsou and Kan, 1990). The genetic progress for actual values was estimated as follows:
6 = 2 ´ (bpy - bpy/s)
where bpy is regression of performance on year and bpy/s is regression of performance on year within sire. Smith’s method has been applied widely in pig breeding studies (Smith, 1963; Ollivier, 1974; Zarnecki, 1979; Standal, 1979; David et el., 1985; Tixier and Sellier, 1986). The comparison of this method and the Henderson’s (1973) mixed model method have demonstrated an agreement in swine(Zarnecki, 1979; Lundeheim and Eriksson, 1984).
Table 6 shows that most of the annual genetic changes were in a favorable tendency except the BF of Landrace. In general, genetic gains of BF were smaller than those of ADG and had a larger estimate error. The genetic progress of ADG was larger than the changes of phenotypic trends which may be overestimated due to unexpected selection and/or deterioration of uniform environment within farm.
When comparing the genetic change of on - farm testing traits with other countries (Table 7), the annual genetic gain of ADG in Taiwan was 10-30g, about 2.3-5.9% per year, about ten times higher than those shown for others. However, the genetic gain of BF for Taiwan, except Duroc breed, was lower. Some biases such as assortative mating, selection on progeny test, or age of dam effects were also involved, but these differences may be of only minor importance. However, there was not enough information to discriminate them. More basic items should be added to the data collection in this program. Table 7 also indicates that annual genetic gains evaluated from on-farm test data were lower or had larger errors than other kinds of test data.
*Economic return from pure breeds’ genetic improvement
Economic return in commercial hogs from on-farm test program pure breeds’ genetic improvement in Taiwan was evaluated on some assumptions: (1) no heterosis was considered, (2) sixty percent of market hogs were assumed to be three-breed crossed, and (3) economic values were the same in the selection index construction. The estimated annual benefits is about 120 million NT$, about four times the interest in pig breeding programs (Tsou, 1990d).
Mitchell et al. (1982) estimated a fifty times annual benefits in the U. K. by a discount rate method. There was a bigger pig population there than that in Taiwan; beyond that, other factors such as production systems, interaction between farms, change in correlated traits, and uncertainty about husbandry and marketing needs may affect these results (Smith et al., 1982).
LOCAL GENETIC PARAMETERS AND THEIR INFLUENCE ON SELECTION
Tsou et al. (1990) made preliminary analysis of a population from data of on-farm test, central boar test, and national nuclear herds. These results, summarized in Table 8, revealed that phenotypic standard deviations of FE and BF were smaller than those adopted by Chyr (1980). The small variation of traits obtained may be due to limited feeding or less feed intake in the local hot climate. Heritabilities in parentheses of Table 8 were calculated from on-farm test data of 22 farms. They show a large variation between farms.
Correlations between ADG and FE were all in median and negative directions either in phenotype or in genotype for each breed studied. There was a small but significant positive relationship between ADG and BF. Results also revealled genetically antagonistic effects on total economic value improvement. It was also found that the FE and BF had positive relationships for all breeds except Hampshire.
All of these phenotypic and genotypic parameters varied widely and the actual value was smaller than that used by the present selection index. If errors of parameter estimates can not be eliminated, how is the efficiency of selection index influenced? and how to introduce a new selection index and extend it properly with minimum fuss?
To find the application sensitivity of selection index, Tsou (1990c)used the Central Boar Test Station data to do a simulation study. He found that tolerance limit of selection index is broad when the phenotypic variation of traits was within 40%, or the heritability varied less than 30%, or genetic correlation changed within 0-0.25, or the economic weight ranged 50%. The expected genetic gain for each trait changed less than 10%. However, if many parameters were lower or higher than those in the selection index construction, the bias of predicted genetic gain was large. The new selection index formed by these local parameters in Table 7, however, was almost the same as the present one when the selection rate was below 10%. On the other hand, the presently used index overestimated the breeding value of pigs when the selection rate was over 30%. This study also showed a negative effect of daily feed intake in Yorkshire and Duroc, but was positive in Landrace. These results suggests that a new selection index should be constructed for more emphasis on balanced growth, and backfat change and enhanced appetite.
THE FUTURE
This preliminary analysis indicated that on-fare selection has succesfully improved growth rate and backfat, while reproductive traits have shown a small negative trend. Body structure and meat quality also deteriorated in recent years. Some steps can be taken to redress undesirable changes and/or increase selection accuracy in the near future, such as to adopt combined selection indices by breed/line, apply a soundness linear scoring system, use a mixed model statistics method, set and/or add new testing traits, adjust end-test weight, and enhance relationships with artificial insemination centers and other breeding programs.
*To adopt combined selection indices depends on individual
breed/line selection goals
Reproductive performance will become a more important item in in the future when growth and backfat are improved to a high level. Recent studies in the world showed that genetic improvement of litter size can be achieved by the use of Chinese high sow productivity breeds, artificial insemination in group nucleus herds, the mixed model statistics procedure, and even by the techniques of genetic engineering (Webb, 1991). Besides, the selection goals of a breed/line may be maternal, paternal or general improvement depending on the role it plays in commercial crossed pig production. Growth performance index and sow productivity indices of on-farm test could be combined into different selection indices for multiple purposes uses.
*To apply the body soundness linear scoring system
Body soundness includes body type, feet, and bone structure, external reproductive organs, and health status. Most of them have medium to high heritability and can be improved by selection. One can appraise an individual soundness trait with proper training, however it is still trouble some to combine all of these soundness traits to make a selection decision. Kan and Tsou(1991) derived a soundness index by applying the multi - variate analysis method to conduct a generation soundness selection experiment in the National Swine Nucleus Herd (northern). They obtained a high heritability of 0.70 (s. e.= 0.22) for soundness index by parent - offspring regression analysis. This result indicates that the selection by a soundness index may prevent the body structure problem.
*To set and/or add new testing traits
If genetic improvement just emphasizes feed efficiency and lean meat production, it may cause appetite failure which has direct and indirect effects on the reproduction, meat quality and lean meat upper limit production. The measurement of daily feeds intake is not the only way to improve feeds efficiency but we must do so to improve the appetite for high meat production breeding pigs. The automatic electric-feeder is helpful to measure an individual pig’s feeds intake and will be widely used in nucleus herds to improve or keep its appetite.
Reducing backfat of pigs can increase the amount of their lean meat. However, selection for hackfat improvement cannot break through the upper limit of lean meat production. Therefore, to measure lean meat growth rate and feed efficiency as long-term selection goals is necessary. The amount of lean meat in alive pigs can be roughly predicted by backfat, loineye area, and body weight in an on-farm testing program.
Undesirable meat color and water capacity were found in fast growth, thin backfat, high lean meat ratio, and heavy body weight pigs (Young, 1991). Neat chemical composition and eating quality will be considered to be more important by future consumers. The definition of meat quality will become more complicate; as a result, a combined meat quality index should be set up. Furthermore, the pig stress gene which was negatively correlates with meat quality can be rided by halothern test and its DNA probe, and can partially solve meat quality problem.
*To utilize the mixed model statistical procedure
The use of mixed model procedure (BLUP) can widen the adoption of relative records which tested in different tines or locations, adjust fixed effects bias, and enlarge the estimated accuracy of breeding value of pigs. It is especially useful for lot heritability traits. Some simulation studies in pigs have confirmed its value(Wray, 1990; de Vries and Sarensen, 1990), and found that it will increase the selection accuracy rate from 20K to 40% for low heritability traits and 5-10% for medium heritability traits. Recently, this method has been used in many countries, such as Canada, Ireland, the United States, the U. K., and Denmark, on the mainframe computers for pig breeding purposes. Packages of BLUP for the personal computer have been developed in recent years (Long et al., 1990; Groeneveld et al., 1990), and are worthwhile to adopt for on-farm testing programs.
*To adjust end-test weight
Because of the emphasis on the improvement of lean meat production in the last decade, the average marketing weight of hogs has changed from 90kg to 100kg in Taiwan, and it will be possible to increase continuously into the near future. Raising the end-test weight higher should be considered, especially for the paternal breed/line, to meet the marketing and producers’ requirements in the future.
*To enhance the relationships with A. I. centers and other national breeding programs
Although one of the main purposes of the on-farm test is to assist breeders to proceed with their own breeding schemes, the use of boars from A. I. centers in their own and other farms with progeny test on-farm may reduce the interaction of genetic X management systems, increase accuracy of comparisons across herds, and find suitable breeding resources they need. To combine records from other performance testing programs will increase the selection accuracy and highly promot the genetic improvement of pigs for the whole country.
REFERENCES
1. Chyr, S.C. 1980. [Swine selection index and direction of pig improvement.] J. Chin. Soc. Anim Sci. 9,55,-69.
2. Chang, H.L. 1990. [Simulation analysis of selection index in pig.] J. Chinese Soc. Anim. Sci. 19 (suppl.):22 (abstr.).
3. David, P.3., Johnson, P.K. and Socha, T. E. 1985. Estimates from Nebraska SPF swine field records. J. Anim. Sci. 61, 1411-1420.
4. de Vries, A. G.; H. A. M. Van der Steen; G. de Roo, l990. Effects of family size in selection and testing in a close dam line of pigs. Live. Prod. Sci. 24:36-63.
5. Graeneueld, E.; M. Kovac and T. Wang, 1990. PEST, a general purpose BLUP package for multivariate prediction and estimation. Proceed. of the 4th Wld. Cong. on Genetics Applied to Live Prod. XIII: 448-491.
6. Ran, N. T., Tsou, H.L. and Huang, Y.H. 1992. [Application of multiple variables analysis method for external body comfornation in pig.] J. Chinese Soc. Anim. Sci. 21 (suppl.): 31 (abstr.)
7. Lindhe, B., Averdnnk, G., Brascamp, E. W., Duniec, H., Gajic, I. M., Legault, C. and Steane, D. E. 1980. Estimation of breeding value in pigs. Livest. Prod. Sci. 7:269-282.
8. Long, T. E., Johnson, R. K. and Keele, J. W. 1990. Effects of errors in pedigree on three methods of estimating breeding value for litter size, backfat and average daily gain in swine. J. Anim. Sci. 68:4069-4078.
9. Long, T., Brandt, H. and Hammond, K. 1991. Application of best linear unbiasid prediction to genetic evaluation in pigs. Pig News and Information 12:217-219.
10.Lundeheim, N. and Eriksson, J.A. 1984. Estimating genetic change in the Swedish pig population by using mixed model methodology (BLUP). Acta Aguic. Scand. 34, 97-106.
11.Merks, J.W.M. 1989. Genotype ´ Environment interactions in pig breeding programmes. IV. Sire ´ herd interaction in on-farm test results. Livest. Prod. Sci. 20: 32S-336.
12.Mitchell, G., Smith, C., Makower, M. and Bird, P. J. W. N. 1982. An economic appraisal of pig improvement in Great Britain. l. Genetic and production aspects. Anim. Prod. 35,215-224.
13.NSIF, 1981. Guidelines for uniform swine improvement. U. S. Dept. of Agri., Prog. Aid 1157.
14.O11ivier, L. 1974. Progeny test of the French Large White pig from 1953 to 1966. III. Genetic progress. Ann. Genet. Sel. Anim. 6,447-491.
15.Roberts, D.J. and Curran, M.K. 1981. A comparison of ’on-farm’ and station testing in pigs. Anim. Prod. 33: 291-297
16.Smith, C. 1962. Estimation of genetic change in farm livestock using field records. Anim. Prod. 4,239-251.
17.Smith, C. 1963. Genetic change of backfat thickness in the Danish Landrace pig from 1952 to 1960. Anim. Prod. 5,259-268.
18.Tsou, H.L. 1976. Effect of sex, skeletal size, and maternal breed on perfoumance and carcass traits of heavyweight swine. M.S. Thesis, Iowa State University, U.S.A., p. 127
19.Tsou, H.L. 1989. [The reproduction performance evaluation system and its effect.] J. Chinese Soc. Anim. Sci. 18(3, 4): 4 (abstr.)
20.Tsou, H. L. 1990a. [Effects of purebred gilts growth rate and backfat thickness during performance testing period on their reproductive performances.] J. Chinese Soc. Anim. Sci. 19 (suppl.): 2 (abstr.)
21.Tsou, H. L. 1990b. [Selection index of boar for dam line improvement.] J. Chinese Soc. Anim. Sci. 19(suppl.):10 (abstr.)
22.Tsou, H.L. 1990c. [Application sensitivity of selection index in swine.] J. Chinese Soc. Anim. Sci. 19 (suppl.): 11 (abstr.)
23.Tsou, H. L. 1990d. Genetic improvement and parameters of tested performances in the pig population of Taiwan. The 2nd Sino-Korean Seminar of Pig Prod. Sept. 17-21, Suweon, Korea. pp. 17-39
24.Tsou, H. L. 1991. [Charasteristic of (new) selection index in Taiwan.] The 2nd Swine Breeding Seminar. Pig Res. Inst., Taiwan, July 12, Chunan, Taiwan. pp.1-15
25.Tsou, H. L. and Ran, M. T. 1990. [The realized genetic change of on-farm performances in the Taiwan pig population from 1980 to 1988.] J. Chinese Soc. Anim. Sci. 19:117-129
26.Tsou, H. L., Huang, Y. C., Chiang, Y. N., Chu, W. Y., Chi, C. S., Lao, Z. C., Ken, M. T., Tai, C. and Hsu, L. S. 1990. [Estimates of phenotypic and genetic parameters of growth and backfat traits in Taiwan pig population.] J. Chinese Soc. Anim. Sci. 19(suppl.) :12 (abstr.)
27.Tsou, H. L., Lin, H. H., Lin, C. S. and Yang, W. S. 1992. [ Annual report of pig on-farm testing in 1991-92.] Pig Res. Inst., Taiwan. pp.80
28.Tixier, M, and Sellier, P. 1986. Estimated genetic trends for growth and carcass traits in two French pig breeds. Genet. Sel. Evol. 18, 185-212.
29.Ven Diepen, T. A. and Kennedy, B. W. 1989. Genetic correlations between test station and on-farm performance for growth rate and backfat in pigs. J. Anim. Sci. 67: 1425-1431.
30.Webb, A. J. 1991. Genetic programmes to improve litter size in pigs. in Manipulating Pig Production III, ed. by E. S. Batterham Australasian Pig Science Association, pp. 229-244.
31.Wray, N. R. 1989. Consequences of selection in closed populations with particular reference to closed nucleus herds of pigs. PhD Dissertation, University of Edinburgh, Edinburgh, U. K.
32.Yang, T. S., Liu, S. H. and Lu, S. A. 1991. [Effects of growth performance and carcass quality on appearance characteristics of pork.] J. Chinese Soc. Anim. Sci. 20(suppl.): 30 (abstr.).
33.Yen, H. F. 1986. [Adjustment factors of age and backfat thickness.] Agri. Asso. China (new series) 133, 59-64
34.Zarnecki, A. 1979. Estimation of realized genetic change in the Swedish pig population. Acta Agri. Scan. 29, 98-102.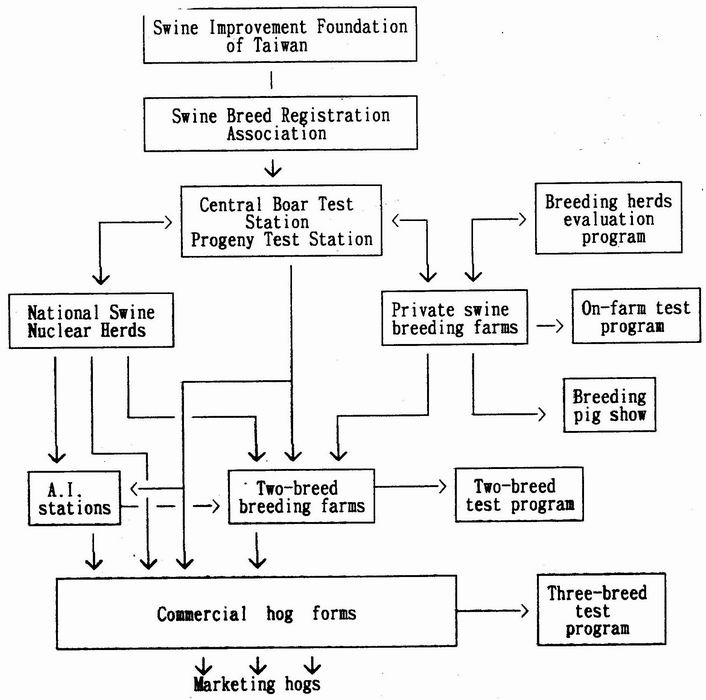 Fig. 1. National swine breeding system of Taiwan |
Fig. 2. Sires’ breeding value evaluation on progeny on-farm test records
Central Boar Testing * Central Progeny Testing * Estimated breeding value
Period:80/8 1/11 Date:82/04/27 Page:1
|
|
|
|
|
ADG |
BF |
AGE |
INDEX |
|
|
|
|
|
BRD |
Farm NO. |
Sire No. (Regist No,) |
Progeny No. (Litter No.) |
progeny performance mean progeny performance breeding value (Breeding value standard deviation) |
Index (EBV) accuracy |
Index (EBV) rank |
|||||
|
L |
21 |
1994-3 |
5 |
1.092 |
2.21 |
1.18 |
149.4 |
138.6 |
0.571 |
1/156 |
|
|
|
|
(92481) |
(3) |
0.078 |
-0.12 |
-0.17 |
-7.8 |
25.2 |
|
|
|
|
|
|
|
|
(0.011) |
(0.04) |
(0.05) |
(2.0) |
(4.5) |
|
|
|
|
|
|
|
|
|
|
|
|
|
|
|
|
|
L |
21 |
1202-3 |
4 |
1.082 |
2.19 |
1.16 |
152.0 |
146.0 |
0.516 |
|
|
|
|
|
(86537) |
(2) |
0.078 |
-0.14 |
-0.12 |
-7.9 |
24.5 |
|
|
|
|
|
|
|
|
(0.012) |
(0.05) |
(0.06) |
(2.3) |
(5.0) |
|
|
|
|
|
|
|
|
|
|
|
|
|
|
|
|
|
L |
16 |
1326-6 |
11 |
0.895 |
2.16 |
1.16 |
170.9 |
119.3 |
0.713 |
3/156 |
|
|
|
|
(78529) |
(6) |
-0.006 |
-0.22 |
-0.26 |
3.4 |
19.6 |
|
|
|
|
|
|
|
|
(0.007) |
(0.03) |
(0.04) |
(1.4) |
(3.0) |
|
|
|
On-farm testing * Porgeny testing * Estimated breeding value
Farm NO.: 35 Period: 78/06/01-81/05/31 Date:81/11/06/ Page:1
|
|
|
|
|
ADG |
BF |
AGE |
INDEX |
|
|
|
BRD |
Sire NO. |
Litter No. |
Progeny No. |
progeny performance mean progeny performance breeding value (Breeding value standard deviation) |
Index (EBV) accuracy |
Index (EBV) rank |
|||
|
L |
520 |
81 |
139 |
0.566 |
0.98 |
158.9 |
109.4 |
0.964 |
1 |
|
|
|
|
|
0.037 |
-.21 |
-10.8 |
17.6 |
|
|
|
|
|
|
|
(0.002) |
(0.01) |
(0.4) |
(0.7) |
|
|
|
|
|
|
|
|
|
|
|
|
|
|
L |
32-5 |
18 |
28 |
0.522 |
0.89 |
171.8 |
110.7 |
0.857 |
2 |
|
|
|
|
|
0.026 |
-.22 |
-9.1 |
15.7 |
|
|
|
|
|
|
|
(0.005) |
(0.02) |
(0.9) |
(1.5) |
|
|
|
|
|
|
|
|
|
|
|
|
|
|
L |
1029 |
50 |
63 |
0.568 |
0.97 |
158.5 |
108.6 |
0.932 |
3 |
|
|
|
|
|
0.027 |
-.19 |
-7.7 |
15.0 |
|
|
|
|
|
|
|
(0.003) |
(0.02) |
(0.6) |
(1.0) |
|
|
Table 1. Change of performance testing methods in Taiwan
|
Item |
Central boar performance test |
|
On-farm performance test |
||||||||
|
1975 |
’79 |
’81 |
’82 |
’89 |
’92 |
|
’80 |
’82 |
’92 |
||
|
Group size: Individual Fullsib-group |
|
|
|
Choosen |
|||||||
|
x------------------->x |
2, group |
|
|
||||||||
|
|
|
|
x---------------->x |
|
|
||||||
|
Feeds: High protein General |
cp.=17.6% |
|
|
Choosen |
|||||||
|
x---------------------------------------------------->x |
|
|
|||||||||
|
|
|
|
|
|
|
||||||
|
Feeding system: Full Restricted |
|
|
|
|
|
|
|||||
|
x---------------------------------------------------->x |
|
Choosen |
|||||||||
|
|
|
|
|
|
|
||||||
|
Testing period: |
|
|
|
|
|
||||||
|
30-90 kg. |
x--------->x |
|
|
|
|
||||||
|
30-110 kg. |
|
x----------------------------------------->x |
|
gilts |
|||||||
|
Birth-90 kg. |
|
|
|
|
|
x-------------->x |
|||||
|
Birth-110 kg. |
|
|
|
|
|
Boars x---->x |
|||||
|
Testing traits: |
|
|
|
|
|
|
|||||
|
Avg. daily gain |
x---------------------------------------------------->x |
|
x-------------->x |
||||||||
|
Feed efficiency |
x---------------------------------------------------->x pen avg. |
||||||||||
|
Utra. backfat |
x---------------------------------------------------->x |
|
x-------------->x |
||||||||
|
Utra. loineye |
|
|
x |
||||||||
|
area |
|
|
|
|
|
|
|||||
|
Selection index: |
|
|
|
|
|
|
|||||
|
Ames, Iowa |
x------------------>x |
|
|
|
|||||||
|
MLC, U. K. |
|
|
|
|
x------->x |
||||||
|
Taiwan |
|
|
x------------------>x xa |
|
|
x------->x |
|||||
|
Progeny test: |
|
|
|
|
|
x |
|||||
|
Reproduction index: |
|
|
|
|
x----------------->x |
||||||
a: Started to use selection indices by breed.
Table 2. Relative economic value of traits in Taiwan pig population
|
Period |
Avg. daily gain |
Feed efficiency |
Ultrasonic backfat |
Selection index used in breeds |
|
|
Relative economic value |
|||
|
1975-1980 |
1 |
0.60 |
0.53 |
L, Y, D, H |
|
1981-1990 |
1 |
1.20 |
0.83 |
L, Y, D, H |
|
1991- |
1 |
0.29 |
0.20 |
L, Y |
|
|
1 |
1.20 |
0.83 |
D, H |
|
|
Percentage of expected economic return in total (%) |
|||
|
1975-1980 |
9.2 |
50.7 |
40.1 |
L, Y, D, H |
|
1981-1990 |
2.9 |
35.4 |
61.7 |
L, Y, D, H |
|
1991- |
44.4 |
42.0 |
13.6 |
L, Y |
|
|
2.9 |
35.4 |
61.7 |
D, H |
Sources: Chyr (1980), Chang (1990), Tsou(1990b)
Table 3. Kinds of sow prouctivity indexes in this system
|
|
Performances evaluated |
||
|
Situiation to be used |
Fertility & nursing ability |
Yearly productivity |
Heat return & conception ability |
|
For present |
SPI |
PSPI |
PSPI -SPI |
|
For culled |
MPSPI |
PMPSPI |
PMPSPI-MPSPI |
|
For breeding |
BVSPI |
PBVSPI |
PBYSPI-BVSPI |
SPI : Sow productivity index
MPSPI : Most Possible Sow Productivity Index
BYSPI : Breeding Value of Sow Productivity Index
PSPI : Periodic Sow Productivity Index
PNPSPI: Periodic Most Possible Sow Productivity index
PBVSPI: Periodic Breeding Value of Sow Productivity Index
Table 4. Number and percentage of on-farm tested pigs by breed and year
|
Year |
Breeds |
Year total |
||||
|
L |
Y |
D |
H |
0 |
||
|
|
Number of tested pigs |
|
||||
|
’80 |
1,221 |
726 |
674 |
134 |
228 |
2,883 |
|
’82 |
1,827 |
920 |
1,418 |
251 |
1,355 |
5,771 |
|
’84 |
2,862 |
2,172 |
2,268 |
1,424 |
1,724 |
10,450 |
|
’86 |
3,349 |
2,763 |
3,157 |
274 |
1,168 |
10,711 |
|
’88 |
3,979 |
2,008 |
3,807 |
194 |
2,993 |
12,978 |
|
’90 |
7,962 |
2,724 |
5,399 |
68 |
1,900 |
18,053 |
|
’92 |
6,506 |
2,812 |
5,318 |
53 |
3,030 |
17,719 |
|
|
|
|
|
|
|
|
|
|
Percentage of year total |
|
||||
|
’80 |
42.3 |
25.2 |
23.4 |
4.6 |
7.9 |
100.0 |
|
’82 |
31.7 |
15.9 |
24.6 |
4.3 |
23.5 |
100.0 |
|
’84 |
27.4 |
20.8 |
21.7 |
13.6 |
16.6 |
100.0 |
|
’86 |
31.3 |
25.8 |
29.5 |
2.6 |
10.9 |
100.0 |
|
’88 |
30.7 |
15.5 |
29.3 |
1.5 |
23.1 |
100.0 |
|
’90 |
44.1 |
15.1 |
29.9 |
0.4 |
10.5 |
100.0 |
|
’92 |
36.7 |
15.9 |
30.0 |
0.3 |
17.1 |
100.0 |
a: L=Landrace, Y=Yorkshire, D=Duroc, 8=Hampshire,
0=Crossbreeds and synthtic breeds.
Source: Tsou et al. (1992)
Table 5. Means of reproductive performances by year and breed during 1987-1992
|
Year |
Breed |
No. of litters |
Litter size at birth |
Litter size at 21 days |
Litter weight at 21 days(kg) |
Survival rate at 21 days(%) |
SPI |
|
’87 |
L |
1059 |
8.5 |
8.1 |
42.9 |
95.3 |
166.0 |
|
|
Y |
643 |
8.6 |
8.3 |
40.3 |
96.5 |
160.7 |
|
|
D |
450 |
6.5 |
6.1 |
29.7 |
93.8 |
127.4 |
|
|
Year |
2255 |
8.3 |
7.8 |
39.8 |
93.9 |
159.1 |
|
|
total |
|
|
|
|
|
|
|
’88 |
L |
992 |
9.0 |
8.5 |
46.9 |
94.4 |
176.7 |
|
|
Y |
490 |
8.5 |
7.8 |
39.0 |
91.8 |
158.6 |
|
|
D |
600 |
7.8 |
7.0 |
34.4 |
89.7 |
148.3 |
|
|
Year |
2175 |
8.5 |
7.8 |
41.2 |
91.8 |
163.6 |
|
|
total |
|
|
|
|
|
|
|
’89 |
L |
1228 |
8.8 |
8.4 |
45.4 |
95.5 |
169.6 |
|
|
Y |
554 |
8.4 |
7.9 |
38.0 |
94.0 |
152.6 |
|
|
D |
776 |
7.9 |
7.3 |
35.9 |
92.4 |
147.4 |
|
|
Year |
2606 |
8.4 |
7.9 |
40.8 |
94.0 |
158.8 |
|
|
total |
|
|
|
|
|
|
|
’90 |
L |
1457 |
9.1 |
8.0 |
43.4 |
87.9 |
171.4 |
|
|
Y |
637 |
8.8 |
7.3 |
35.3 |
83.0 |
154.3 |
|
|
D |
851 |
8.1 |
6.5 |
32.4 |
80.2 |
146.3 |
|
|
Year |
2945 |
8.7 |
7.4 |
38.4 |
85.1 |
160.5 |
|
|
total |
|
|
|
|
|
|
|
’91 |
L |
1361 |
9.4 |
7.7 |
41.9 |
81.9 |
169.2 |
|
|
Y |
656 |
9.1 |
7.4 |
36.5 |
81.3 |
158.9 |
|
|
D |
669 |
8.8 |
6.2 |
30.4 |
70.5 |
146.4 |
|
|
Year |
2686 |
9.2 |
7.3 |
37.7 |
79.3 |
161.0 |
|
|
total |
|
|
|
|
|
|
|
’92 |
L |
1094 |
9.4 |
7.8 |
44.0 |
83.0 |
173.8 |
|
|
Y |
771 |
8.7 |
6.8 |
35.4 |
78.2 |
155.0 |
|
|
D |
612 |
8.3 |
6.1 |
31.3 |
73.5 |
146.9 |
|
|
Year |
2477 |
8.9 |
7.1 |
38.2 |
79.8 |
161.3 |
|
|
total |
|
|
|
|
|
|
SPI= 6.5*(1itter size at birth)+2.2*(litter weight at 21 dayp)
Soorce: Tsou et al. (1992).
Table 6. Estimates of annual phenotypic change and genetic change of on-farm testing performance in actual values (percentage of mean)
|
Breed |
Phenotypic change |
Genetic change |
||
|
ADG(g) |
BF(mm) |
ADG(g) |
BF(mm) |
|
|
Landrace |
13.0**(2.6) |
-0.59**(3.1) |
29.4**(5.9) |
0.12(0.7) |
|
Yorkshire |
10.5**(2.0) |
-0.42**(2.2) |
29.2**(5.5) |
-0.14(0.7) |
|
Duroc |
5.6**(1.1) |
-0.28**(1.4) |
11.8(2.3) |
-0.27 (1.3) |
*,**: Over 2 or 3 times of S.E., respectively.
ADG: Average daily gain from birth.
BF : Ultrasonic backfat.
Source: Tsou and Kan (1990)
Table 6.1 Annual phenotypic change of testing performances in boar test station from 1975 to 1988
|
Breed |
Avg. daily gain (g) |
Feed efficiency |
Ultrasonic backfat(mm) |
Age to 110kg wt. (day) |
|
|
In actual units |
|||
|
Landrace |
3.1 |
-0.043 |
0.66 |
-1.0 |
|
Yorkshire |
3.8 |
-0.007 |
0.55 |
-1.5 |
|
Duroc |
6.9 |
-0.045 |
0.62 |
-2.5 |
|
|
|
|
|
|
|
|
In percentage units |
|||
|
Landrace |
+0.4% |
-1.4% |
-2.8% |
-0.5% |
|
Yorkshire |
+0.5% |
-0.3% |
-2.1% |
-0.8% |
|
Duroc |
+0.8% |
-1.4% |
-2.5% |
-1.3% |
Table 7. A comparison of genetic change of testing performance in Taiwan with other countries’
|
|
|
|
|
|
Performance |
||
|
Country |
First author |
Data period |
Tested methoda |
Breed |
Avg. daily gain (g) |
Backfat (mm) |
Feed efficiency |
|
Taiwan |
Tsou (1990) |
1980-88 |
OF |
L |
+29.4 |
+0.13 |
-.043b |
|
|
|
|
Y |
+29.2 |
-0.14 |
-.007b |
|
|
|
|
|
D |
+11.8 |
-0.26 |
-.045b |
|
|
Denmark |
Smith |
1952-60 |
BT |
L |
|
-0.18 |
|
|
|
(1963) |
|
|
|
|
|
|
|
Norway |
Standal (1979) |
1970-76 |
BT |
L |
+4.3 |
-0.94 |
-.038 |
|
Sweden |
Zarnecki (1979) |
1968-73 |
PT |
L |
+9.0 |
-0.70 |
-.030 |
|
|
Lundeheim |
1976-80 |
PT |
L |
+6.0 |
-0.27 |
-.032 |
|
|
(1984) |
|
|
Y |
+4.0 |
-0.47 |
-.031 |
|
U. K. |
Mitchell (1982) |
1970-77 |
CT |
L |
+5.0 |
(+0.7%) |
-.027 |
|
Canada |
Hudson |
1974-82 |
OF |
L |
-.43c |
-0.14 |
|
|
|
(1985) |
|
|
Y |
-.36c |
-0.12 |
|
|
|
|
|
|
D |
-.15c |
-0.05 |
|
|
|
|
|
|
H |
-.33c |
-0.04 |
|
|
France |
Tixier |
1970-81 |
PT |
LW |
-4.7 |
|
-.003 |
|
|
(1986) |
|
|
L |
+3.2 |
|
-.022 |
|
|
|
1969-81 |
BT |
LW |
+2.9 |
-0.26 |
-.011 |
|
|
|
|
|
L |
+1.0 |
-0.16 |
-.008 |
a: OF=on-farm test data, BT=boar performance test data,
PT=progeny test data, CT=control herds
b: phenotypic change of boar test station
d: days at 90kg weight. Source: Tsou (1991).
Table 8. Assumed and estimated phenotypic and genetic parameters in the pig population of Taiwana
|
|
|
Estimated breedc |
|||
|
Traits |
Assumed estimates |
L |
Y |
D |
H |
|
|
|
Phenotypic standard deviation |
|||
|
ADG |
.09 |
.09 |
.10 |
.09 |
.09 |
|
FE |
.26 |
.17 |
.18 |
.15 |
.14 |
|
BF |
.46 |
.10 |
.12 |
.11 |
.09 |
|
|
|
|
|
|
|
|
|
|
Heritability |
|||
|
ADG |
.30 |
.19(0-.42) |
.16(0-.22) |
.18(0-.40) |
.33 d |
|
FE |
.35 |
.0 |
.0 |
.44 |
.70 d |
|
BF |
.50 |
.22(0-.48) |
.17(0-.63) |
.11(0-.40) |
.26 d |
|
|
|
|
|
|
|
|
|
|
Phenotypic correlation |
|||
|
ADG´FE |
-.50 |
-.468 ** |
-.393 |
-.409 ** |
-.543 ** |
|
ADG´BF |
.25 |
.086 * |
.228 |
.132 ** |
.264 |
|
FE´BF |
.15 |
.081 |
.107 |
.102 ** |
-.198 ** |
|
|
|
|
|
|
|
|
|
|
Genetic correlation |
|||
|
ADG´FE |
-.70 |
-.573 |
-.296 |
-.617 |
|
|
ADG´BF |
.25 |
.105 |
.214 |
.232 |
|
|
FE´BF |
.30 |
.152 |
.206 |
.149 |
|
a: Estimates in parentheses were calculated from on-farm test
data, others evaluated from Central Boar Test Station and
National Nuclear Herds’ data (Tsou et al., 1990)
b: Chyr (1980) adopted from foreign research papers
c: L=Landrace, Y=Yorkshire, D=Duroc, H=Hampshire
d: Lee (1979)
此文件的網址 :
https://agrkb.angrin.tlri.gov.tw/index.php?page=3414