|
|
[回上頁 | 顯示此文件為可列印格式]
此文件提供者: shuYing - [評分 : 0.00 (0 票選) | 評分!]
A LONG TERM SELECTION FOR THE DURATION OF FERTILITY IN THE INTERGENERIC CROSSBREEDING OF DUCKS
Y. S. Cheng 1*, R. Rouvier 2, J. P. Poivey 23, H. L. Liu 1, S. C. Huang 1, Y. C. Huang1,
C. W. Liao1, J. J. Liu Tai1, and C. Tai 4
1 Livestock Research Institute, Council of Agriculture, Hsin-Hua, Tainan, 71246 Taiwan, Republic of China
2 Institut National de la Recherche Agronomique, Station d'Amélioration Génétique des Animaux, Centre de Recherches de Toulouse, BP 27, F 31326 Castanet-Tolosan Cedex, France
3 Centre de coopération Internationale en Recherche Agronomique pour le Développement,, Campus de Baillarguet, F 34398 Montpellier Cedex 5,
4 National Science Council, Taipei, 106 Taiwan, Republic of China
* Corresponding author, e-mail: yushin@mail.tlri.gov.tw
ABSTRACT A 12-generation selection experiment comprising a selected (S) and a control (C) line was conducted with the objective of increasing the number of fertile eggs (NEF) of the Brown Tsaiya duck after a single artificial insemination (AI) with pooled Muscovy semen. Both lines consisted of about 20 males and 60 females as parents in each generation and each female duck was tested 3 times, at 26, 29 and 32 weeks of age. The fertile eggs were measured by candling at day 7 after incubation. The selection criterion in the S line was the BLUP animal model value for NEF. On average, 28.9% of females and 17.05% of males were selected. The direct response to the selection for NEF, and correlated responses for the number of eggs set (NES), the number of total dead embryos (NED), the maximum duration of fertility (MD) and the number of hatched mule ducklings (NEH) were measured by the differences across the generations of selection between the phenotypic value averages in the S and C lines. The selection responses and the predicted responses had similar trends. The average selection responses per generation were 0.40, 0.45, and 0.32 genetic standard deviation units for the NEF, MD, and NEH traits respectively. Embryo viability was not impaired by this selection. For days 2-8 after AI, the fertility rates (NEF/NES) were 89.14% and 61.46% (26-32w);88.88% and 62.26% (36-42w), the hatchability rates (NEH/NEF) were 60.62% and 69.26% (26-32w);73.0% and 73.06% (36-42w) respectively in the S and Clines. The largest increases of the fertility per day rates after a single AI were observed between d5 and d11. In the selected line, in G12, the fertility rate was 91% at d2, 94% at d3, 92% at days 4 and 5 and decreased to 81% at d8, 75% at d9, 58% at d10 and 42% at d11. The same tendencies were observed for the changes in the evolution of the hatchability according to the egg set rates. It was concluded that selection on the number of fertile eggs after a single AI with pooled Muscovy semen could be effective in ducks to increase the duration of the fertile period and that research can now be focused on the detection of a quantitative trait locus of the duration of fertility and on how to improve the viability of the hybrid mule duck embryo.
KEY WORDS: Long term selection , Fertile eggs, Brown Tsaiya, Muscovy.
INTRODUCTION The mule duck is the major commercial source of meat (soup or roasted duck) and is produced by crossing Tsaiya, Pekin ducks or Kaiya ducks with the Muscovy drakes. The application of artificial insemination has successfully improved the reproductive efficiency of ducks in the last twenty years in Taiwan (Tai, 1985), it is also a popular method in France, where male mule ducks are force-fed to produce “foie gras” (fatty liver) and the female can be used for meat production (Rouvier et al., 1987, 1988). So, in the last few decades, it has become common to use AI as a production technique for mule duck, both in France and Taiwan. Unfortunately, owing to the short duration of fertility in that intergeneric crossbreeding, AI has to be practised twice a week in order to maintain the fertility rate (Huang and Chow, 1974; Liu et al., 1980; Rouvier et al., 1984). It would be economically beneficial to inseminate the female duck once a week instead of twice a week to maintain the fertility rate. So the aim of the study was to increase the duration of the fertile period in order to reduce the frequency of AI required. Previous results in domestic fowl have shown that selection for a longer fertile period was feasible (Pingel and Planert, 1987; Pingel, 1990). Thereafter, Tai et al. (1994) found that the best selection criterion for duration of fertility seemed to be the number of fertile eggs laid from the 2nd to the 15th day after a single AI with pooled Muscovy semen. Therefore, in 1992, the Livestock Research Institute (LRI), Hsinhua, Tainan, Taiwan initiated a selection experiment for an increased number of fertile eggs (NEF) (measured by candling on the 7th day during incubation) in the Brown Tsaiya female duck after a single AI with pooled Muscovy semen, using a selected and a control (unselected) line (Cheng, 1995). In order to increase the efficiency of the selection method, the best linear unbiased predictors (BLUP) using an animal model were preferred to the conventional selection index, to evaluate the breeding values of the male and female ducks. Up to the present, selection for the duration of fertility in mule ducks has been carried out and the selection have brought tremendous profit to the duck farmers. In addition, the genetic parameters and selection response for the duration of fertility of intergeneric crossbreeding were reported through the cooperative researches among LRI-COA, NSC and INRA (Poivey et al., 2001; Cheng et al., 1999ab, 2000, 2002, 2003, 2005). We would like to appreciate for their financial support and also the staff at LRI-COA and INRA-SAGA for their help in carrying out this research. The results obtained are summarized as below.
ANIMALS AND DEVELOPING LINES A total of one hundred and six Brown Tsaiya LRI no. 2 female ducks and 28 Brown Tsaiya LRI no. 2 drakes originating from a Brown Tsaiya Line 105 studied for laying traits, developed at the Ilan branch of Livestock Research Institute (LRI) were used as the breeding stocks to provide the animals for the fertilization durability selection (Cheng et al., 1995, 1996). Founder birds were assumed to be neither related, nor inbred. In first generation (G1), 165 ducks and 117 drakes were divided into two groups. In the selected line, 48 ducks and 23 drakes bred from the different parents, and with the highest index values for NEF were used to produce the subsequent generation as selected line. In the control group, 46 ducks and 20 drakes were selected based on the average number of fertile eggs of respective gender to produce the subsequent. The number of ducks involved in each generation, the number of hatches, the percentage of selected animals, and the selection differentials on breeding values of NEF in the C line was shown in Table 1. The first hatch in G1 was on February 16, 1992 and the last one in G12 was on January 4, 2005. Both lines were maintained at the same time under standardized conditions at the LRI experimental farm in Hsinhua, Tainan.
(1) Selected line In the S line, male and female ducks in each generation were selected by truncation on superior values of the BLUP animal model for the number of fertile eggs from the 2nd to the 15th day after AI (3 times). The model for the breeding values of the selected trait was the following, as described in Cheng (1995):
y = Xb + Z1 a + Z2 p + e Where y=vector of observations. b=vector of fixed effects of hatching date.
a=vector of random genetic effect with E(a)=0, Var(a)=A, where A is the additive genetic relationship matrix of the animals,=the additive genetic (co)-variances.   p=vector of random repeat effect with E(p)=0, Var(p)=I, where I is the identity matrix, =the (co)-variances of repeat effects.   e=vector of random residual effects with E(e)=0, Var(e)=I, where =the (co)-variances of random residual effects.   X,
Z1 and
Z2 = matrices relating the elements of b, a and p to the observations.
In each generation, all the ancestors of the selection candidates back to the founder animals were taken into account to establish the additive genetic relationship matrix. The performance of ducks in all generations (from G1) was also taken into account.
The estimated genetic parameters used were h2=0.34 (Tai et al., 1994) and repeatability r=0.47 (estimated from G1 data), for G1 up to G3. h2=0.29 and r=0.40 (Cheng, 1995) for G4 to G6, and h2=0.26 and r=0.36 (Poivey et al., 2001) from G7 to G12. The breeding values of the candidate to be selected were computed, using a program by Poivey (1986) for G1 to G3, and with the PEST program (Groeneveld, 1990) thereafter. It was scheduled to select 20 males and 60 females in each generation, in order to mate one male with 3 females to produce the offspring to be measured in the following generation.
Table.1 | The experimental population for the selection on the duration of fertility
|
Generation | Line | Batch of hatch | Dates of hatch | Ducks | Parents | % of selection | S.D | G0
(S26-32weeks) | | | | | M=28 F=106 | | | G1 | | 1 | 16/02/1992 | M=117 F=165 | M=23(S) F=48 M=20(C) F=46 | 19.7 29.1 | +0.179 | G2 | S | 2 | 10/02/1993 09/03/1993 | M=170 F=214 | M=20 F=51 | 11.8 23.8 | | | C | 1 | 07/04/1993 | M=97 F=151 | M=20 F=53 | | +0.024 | G3 | S | 1 | 14/03/1994 | M=96 F=213 | M=20 F=58 | 20.8 27.2 | | | C | 1 | 14/03/1994 | M=60 F=228 | M=20 F=56 | | -0.259 | G4 | S | 2 | 23/02/1995 30/05/1995 | M=133 F=232 | M=20 F=58 | 15.0 25.0 | | | C | 2 | 23/02/1995 30/05/1995 | M=67 F=135 | M=19 F=53 | | -0.064 | G5 | S | 1 | 13/05/1996 | M=184 F=248 | M=20 F=50 | 10.9 20.2 | | | C | 1 | 13/05/1996 | M=120 F=193 | M=20 F=54 | | -0.148 | G6 | S | 1 | 02/05/1997 | M=105 F=175 | M=20 F=55 | 19.0 31.4 | | | C | 1 | 02/05/1997 | M=126 F=173 | M=20 F=53 | | -0.074 | G7 | S | 2 | 12/05/1998 19/05/1998 | M=126 F=296 | M=20 F=61 | 16.0 20.6 | | | C | 2 | 12/05/1998 19/05/1998 | M=158 F=290 | M=20 F=61 | | -0.200 | G8 | S | 1 | 14/06/1999 | M=114 F=204 | M=20 F=70 | 17.5 34.3 | | | C | 1 | 14/06/1999 | M=94 F=157 | M=20 F=42 | | -0.209 | G9 | S | 1 | 12/12/2000 | M=166 F=272 | M=12 F=57 | 7.2 21.0 | | | C | 1 | 12/12/2000 | M=54 F=130 | M=20 F=57 | | -0.106 | G10 | S | 1 | 02/25/2002 | M=74 F=207 | M=12 F=56 | 16.2 27.1 | | | C | 1 | 02/25/2002 | M=43 F=173 | M=20 F=57 | | +0.030 | G11 | S | 1 | 02/25/2003 | M=89 F=226 | M=13 F=42 | 14.6 18.6 | | | C | 1 | 02/25/2003 | M=97 F=227 | M=18 F=33 | | -0.493 | G12 | S | 2 | 10/25/2004 01/04/2005 | M=64 F=150 | M=12(1) F=60 | 18.8 40.0 | | | C | 2 | 10/25/2004 01/04/2005 | M=64 F=83 | M=20(1) F=60 | | +0.291 | Total | S | | | M=1321 F=2437 | | | G1-G12 | C | | | M=1097 F=2105 | | | -1.089 |
S : selected line; C : control line. M : male; F : female. (1) number of parents for planned mating .
S. D: Selection differential in the C line (2) Control line In order to measure the genetic response, the control line was theoretically bred from 20 sires and 60 dams (3 dams per sire). One son of each sire was randomly chosen to replace his father and one daughter of each dam was randomly chosen to replace her mother, for mating according to a rotational scheme as shown in Figure 1 (Matheron and Chevalet, 1977). The mating plan of constitutive groups of breeder in control line for the generation Gn+1 were divided into 20 groups, the 3 females of group  are from 3 different sire groups (m=1 to 20). The 20 males stayed in their groups. One sire gives one male and one dam gives one female, the sire of group G is the son of group G, his mother is one of 3 dams of group . The 3 dams of group give 3 females, the first go to the group are from 3 different sire groups (m=1 to 20). The 20 males stayed in their groups. One sire gives one male and one dam gives one female, the sire of group G is the son of group G, his mother is one of 3 dams of group . The 3 dams of group give 3 females, the first go to the group      , the second to the group and the third to the group , the second to the group and the third to the group   . . 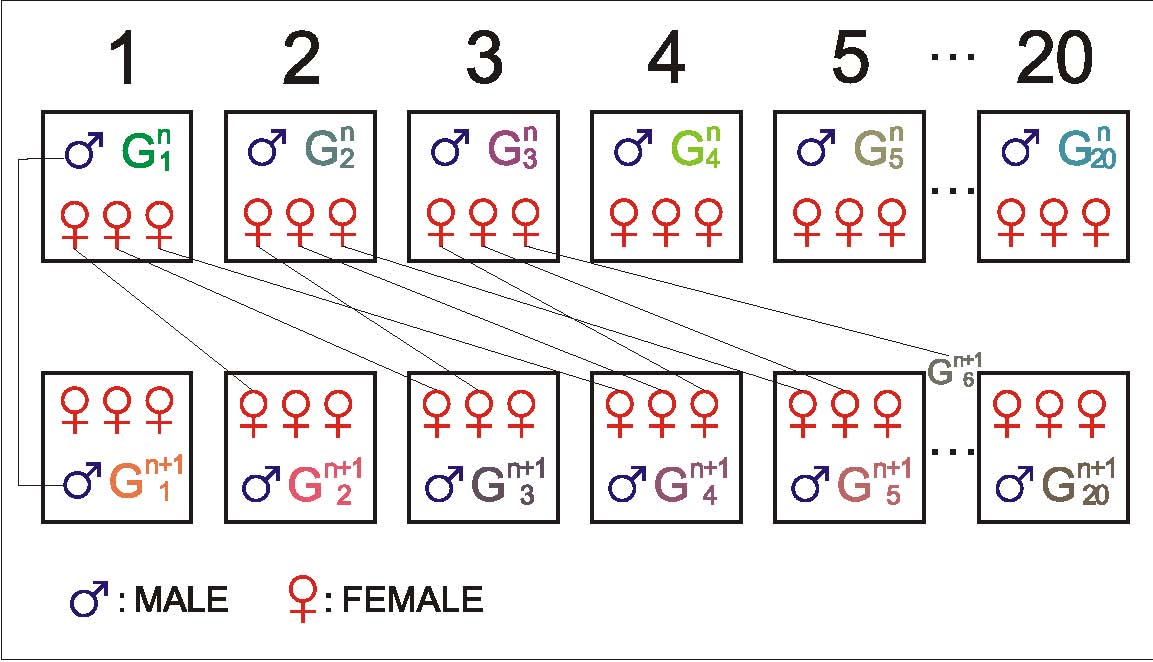
Figure 1. | Mating plan of control line |
Starting from the progeny of the founder stock (G0), this selection experiment was conducted over 12 generations from 1992 to 2005 (G1 to G12) and over eleven generations of selection (G1 to G11). Generations were kept separate and the generation interval was one year. In total, from G1 to G12, 3758 and 3202 ducks in the S and C line respectively were controlled. In the S line, the percentage selected was between 40% and 20.2% in females and between 10.9% and 20.8% in males.
MANAGEMENT AND EXPERIMENT The ducklings were raised in floor pen and fed from 0 to 4 wk with a diet containing (CP=19 %, ME=2,925 kcal/kg), and from 5 to 15 wk (CP=13 %, ME=2,830 kcal/kg). From age of laying first egg, ducks were raised in individual cages. During the laying period, ducks were fed with a diet containing CP=20 % and ME=2,810 kcal/kg. Drinking water and feed were provided for ad libitum consumption throughout the experimental period. The ducks at 26, 29, and 32 weeks of age were artificially inseminated with 0.05 mL of pooled semen from 10 to 15 Muscovy drakes from line 302 of LRI, Ilan Station (Tai Liu and Tai, 1984, 1991). After a single AI, eggs were collected from day 2 to 15 for G1 to G6, and from day 2 to 18 for G7 to G12. They were stored for 7 days and 9 days respectively before egg set in the incubator. Fertility was measured by candling the eggs after 7 days of incubation, and the number of live hatched ducklings was recorded. Data regarding the number of eggs set (NES), the number of fertile eggs at candling (NEF), the number of total dead embryos (NED), the maximum duration of fertility from the 2nd day after AI up to the day of the last fertile egg (MD), and the number of hatched mule ducklings (NEH) were collected. A new generation of ducks was produced by pedigree mating and pedigree hatch was conducted in each generation. The PALMI recording system was used to collect the performances data of duck (Batut, 1996).
STATISTICAL ANALYSIS The parameters of elementary statistics (means and variances) of phenotypic values were obtained using the SAS procedure (SAS, 1996). The selection differentials on breeding values of NEF in the C line were calculated in each generation, as differences between the averages of animals randomly chosen as parents and of all animals measured in that generation. They were calculated in order to detect unintentional selection. The inbreeding coefficients were calculated in each generation for the females and the males of each line. The cumulated generation direct and correlated selection responses were measured as the differences in the averages of phenotypic performance of animals in the S and C lines. Their variances were calculated by taking into account the variance of error measurements and genetic drift variance (Hill, 1972ab, 1980; Falconer and Mackay, 1996).
The predicted genetic responses to selection on NEF was estimated from the within generation line difference (S-C) for average predicted breeding values for each of the 5 traits in female ducks. These breeding values were calculated in a 5-trait analysis using the BLUP methodology applied to an individual animal model previously described for one trait. These multiple-trait BLUP animal model values were calculated using the records of all 5 traits together for the selected and control lines from G1 to G12, using the PEST 3.1 package (Groeneveld, 1990; Groeneveld and Kovac, 1990), with a performance file containing 11721 records and a pedigree file of 7096 animals. For these estimations of breeding values, the genetic and phenotypic parameters for the five traits were taken from Poivey et al, (2001) (Table 3). For simplification, the approximate standard errors for the generation S-C differences were calculated for each trait with the estimated parameters, considering that the breeding values were computed in univariate analyses (Sorensen and Kennedy, 1986).
PERCENTAGE OF SELECTION Table 1 shows the number of females measured and selected as parents, the number of males raised and selected as parents in each generation in the S line, as well as the percentage of selected animals. In the C line, it shows the number of measured females and of raised males, as well as the number of randomly chosen parents and the realized selection differential, in each generation. In total, from G1 up to G12, 1321 males, 2437 females, and 1097 males, 2105 females, in the S and C line respectively were controlled. In the S line, the selection was effective from G1. Over the 11 generations of selection, the average percentage of selected females was 28.9% and the average percentage of selected males was 17.05%. The unintentional selection differential which occurred in the C line was small (-1.089) over the 11 generations of selection. It should be pointed out that the animals of the S and C lines were born in the same hatches in all the generations, except in G2. In G1 some parents were used in the constitution of both the S and C lines ; in G2, the animals of the S line were born on 02/10/1993 and on 03/09/1993, while the animals of C line were born on 04/07/1993. Although the AIs were performed partly at the same period, this could lead to some inaccuracy in the measurement of selection response in G2.
INBREEDING COEFFICIENTS Table 2 shows the mean and standard deviation of inbreeding coefficients in males and females of the S and C lines, for each generation. The founder animals were supposed to be neither related nor inbred. Therefore, the average inbreeding coefficient in G1 was 0. The same case was found in G2, which was rotational in the C line due to the mating plan. On the other hand, which was avoided full-sib and half-sib mating in the S line. Thereafter, it increased more quickly in the S line than in the C line, as could be expected, but it remained moderate, the mean in G12 were 0.154 and 0.068 for the males and 0.156 and 0.074 for the females in the S and C line respectively.
Table 2. Mean ± standard deviation of inbreeding coefficients in males and females of S and C lines
Generation | S line | C line | | | Male | Female | Male | Female | G1 | 0 | 0 | 0 | 0 | G2 | 0 | 0 | 0 | 0 | G3 | 0.018±0.023
| 0.017±0.024
| 0.0078±0.0179 | 0.0067±0.0169
| G4 | 0.036±0.027
| 0.041±0.029
| 0.025±0.026
| 0.022±0.025
| G5 | 0.047±0.029
| 0.053±0.034
| 0.034±0.022
| 0.034±0.022
| G6 | 0.065±0.021
| 0.067±0.024
| 0.038±0.029
| 0.040±0.028
| G7 | 0.084±0.021
| 0.082±0.022
| 0.048±0.029
| 0.047±0.027
| G8 | 0.106±0.026
| 0.106±0.028
| 0.063±0.028
| 0.060±0.024
| G9 | 0.108±0.020
| 0.112±0.024
| 0.066±0.032
| 0.065±0.029
| G10 | 0.117±0.020
| 0.118±0.021
| 0.071±0.033
| 0.065±0.031
| G11 | 0.140±0.023
| 0.142±0.023
| 0.059±0.027
| 0.059±0.028
| G12 | 0.154±0.016
| 0.156±0.022
| 0.068±0.025
| 0.074±0.028
|
SELECTION RESPONSES AND PREDICTED GENETIC RESPONSES
Table 3 shows the genetic parameters (heritabilities and genetic correlations) of the five traits NES, NEF, NED, MD, and NEH which were used to calculate the multiple-trait BLUP animal model values of each trait for all measured females from generation G1 to G12. These genetic parameters were estimated in the conceptual base population (Poivey et al., 2001).
Table 3. Heritabilities (along the diagonal), genetic correlations (above the diagonal), phenotypic correlations (below the diagonal), phenotypic variances (last line) for the five traits, estimated in the base population from the data of the control line up to G5, by Poivey et al. (2001)
Trait1
| NES | NEF | NED | MD | NEH | | | | | | | NES | 0.10±0.01 | 0.53±0.04 | 0.39±0.09 | 0.25±0.05 | 0.37±0.08 | | | | | | | NEF | 0.38 | 0.26±0.01 | 0.61±0.07 | 0.92±0.01 | 0.91±0.01 | | | | | | | NED | 0.12 | 0.33 | 0.09±0.02 | 0.72±0.04 | 0.26±0.08 | | | | | | | MD | 0.23 | 0.73 | 0.29 | 0.21±0.02 | 0.82±0.03 | | | | | | | NEH | 0.27 | 0.76 | -0.17 | 0.54 | 0.19±0.01 | Phenotypic variance | 4.88 | 3.39 | 0.735 | 4.53 | 2.56 |
1 NES = number of eggs set ; NEF = number of fertile eggs at candling (7th day of incubation) ; NED = number of total dead embryos ; MD = maximum duration of fertility ; NEH = number of hatched mule ducklings.
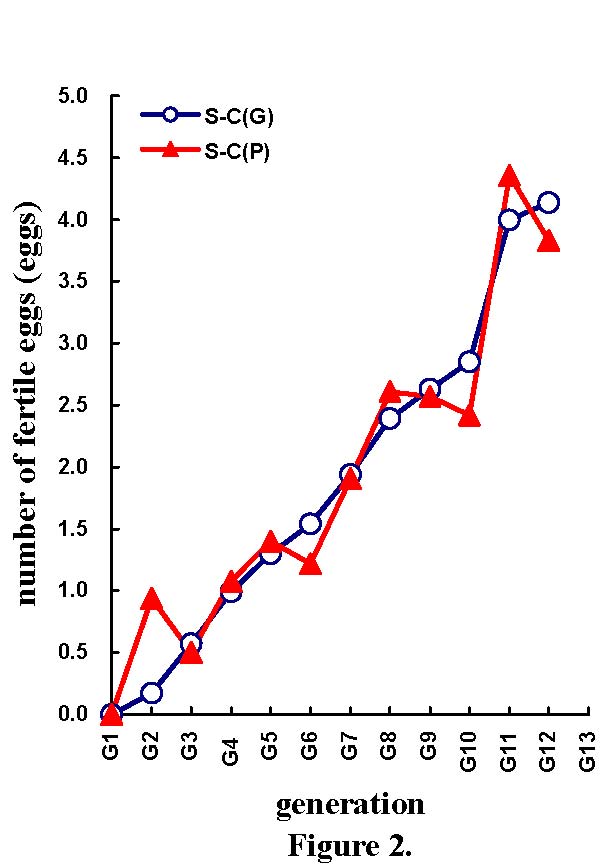
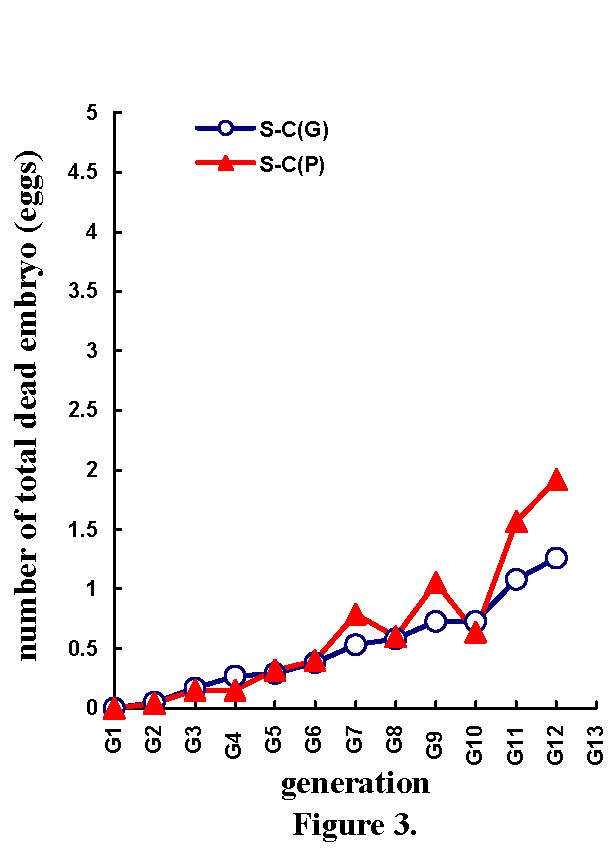
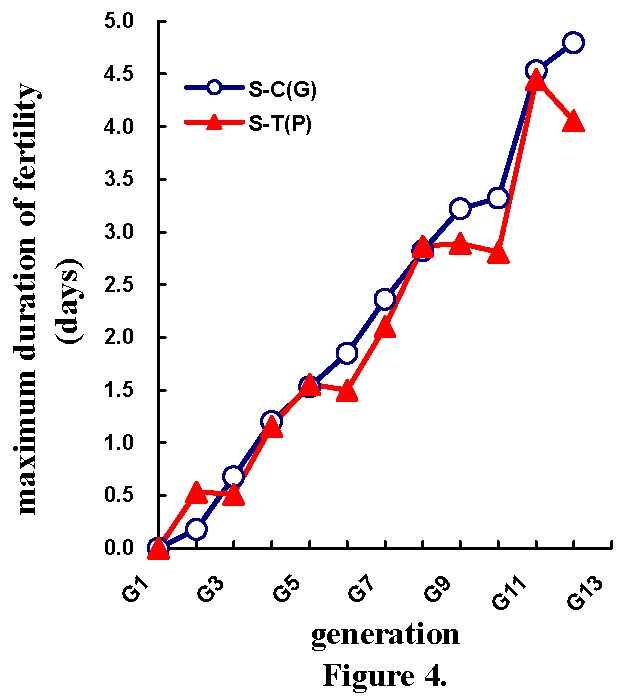
Table 4 shows the mean selection responses (and standard deviations) and predicted genetic responses (and standard errors) across the 11 generations of selection, for the NES, NEF, NED, MD, and NEH traits. Figures 2 to 6 show the trends of selection responses and predicted genetic responses of NEF, NED, MD, NEH, and NES. Both were similar, except that the former showed more fluctuations between the generations. The selection responses were highly significant for the selected trait and the correlated traits MD and NEH. At G11, the mean selection response and the mean predicted genetic response were very close, being 4.36 and 4.00 respectively for NEF, 1.57 and 1.08 for NED, 4.45 and 4.53 for MD, 2.79 and 2.60 for NEH. In G12, the mean selection response and the mean predicted genetic response were very similar, but with more discrepancies. These genetic increases at G11 were represented as a percentage of the average traits in G1: 103% for NEF, 85% for NED, 79% for MD, and 116% for NEH.
 . | Differences in number of fertile eggs at candling (Figure 2), number of total dead embryos (Figure 3), maximum duration of fertility (Figure 4), number of hatched mule ducklings (Figure 5), number of incubated eggs (Figure 6) between selected (S) and control (C) lines for the phenotypic [S-C(P)] and predicted genetic [S-C(G)] values across 11 generations of selection.
|
Table 4. Mean of the traits in G1, selection response mean ± standard deviation (1st line), mean of predicted genetic responses±standard errors (2nd line) for the five traits
Genera- tion | G1 | G2 | G3 | G4 | G5 | G6 | G7 | G8 | G9 | G10 | G11 | G12 | Trait1 | Mean | NES | 11.83 | 0.70 ±0.16 0.09 ±0.026 | 0.20 ±0.20 0.16 ±0.028 | 0.20 ±0.26 0.17 ±0.041 | 0.22 ±.28 0.22 ±0.032 | 0.17 ±0.31 0.26 ±0.032 | 0.22 ±0.33 0.36 ±0.026 | 0.36 ±0.47 0.47 ±0.037 | -0.37 ±0.49 0.46 ±0.038 | 0.35 ±0.79 0.79 ±0.044 | 1.59 ±0.44 1.45 ±0.034 | 1.35 ±0.56 1.59 ±0.047 | NEF | 4.23 | 0.94 ±0.21 0.17 ±0.058 | 0.50 ±0.27 0.57 ±0.060 | 1.08 ±0.32 0.99 ±0.065 | 1.40 ±0.36 1.30 ±0.061 | 1.22 ±.41 1.54 ±0.055 | 1.91 ±0.43 1.94 ±0.041 | 2.61 ±0.50 2.39 ±0.060 | 2.57 ±0.64 2.63 ±0.064 | 2.42 ±0.67 2.85 ±0.057 | 4.36 ±0.62 4.00 ±0.055 | 3.83 ±0.80 4.14 ±0.094 | NED | 1.84 | 0.04 ±0.08 0.05 ±0.019 | 0.15 ±0.09 0.17 ±0.017 | 0.15 ±0.11 0.27 ±0.019 | 0.32 ±0.11 0.29 ±0.013 | 0.40 ±0.14 0.38 ±0.016 | 0.79 ±0.13 0.53 ±0.014 | 0.60 ±0.15 0.58 ±0.019 | 1.05 ±0.28 0.73 ±0.019 | 0.64 ±0.25 0.73 ±0.022 | 1.57 ±0.31 1.08 ±0.018 | 1.92 ±0.37 1.26 ±0.022 | MD | 5.63 | 0.53 ±0.22 0.18 ±0.069 | 0.51 ±0.28 0.68 ±0.072 | 1.16 ±0.34 1.20 ±0.071 | 1.56 ±0.38 1.53 ±0.063 | 1.50 ±0.43 1.85 ±0.059 | 2.10 ±0.45 2.36 ±0.045 | 2.87 ±0.50 2.82 ±0.067 | 2.89 ±0.62 3.22 ±0.069 | 2.81 ±0.70 3.32 ±0.062 | 4.45 ±0.61 4.53 ±.060 | 4.06 ±0.73 4.80 ±0.095 | NEH | 2.39 | 0.90 ±0.17 0.12 ±0.043 | 0.35 ±0.21 0.37 ±0.048 | 0.94 ±0.25 0.67 ±0.052 | 1.08 ±0.28 0.97 ±0.051 | 0.83 ±0.31 1.12 ±0.044 | 1.12 ±0.33 1.33 ±0.032 | 2.02 ±0.36 1.69 ±0.047 | 1.52 ±0.55 1.75 ±0.048 | 1.77 ±0.56 1.98 ±0.042 | 2.79 ±.53 2.60 ±0.038 | 1.91 ±0.68 2.50 ±0.070 |
1NES = number of eggs set ; NEF = number of fertile eggs at candling (7th day of incubation) ; NED = number of total dead embryos ; MD = maximum duration of fertility ; NEH = number of hatched mule ducklings.
Table 5, 6 show the mean (and standard deviation) of fertility and hatchability rates for days 2-15 or days 2-8 after a single AI for the S and C lines in G12 at 26-32 and 36-42 weeks of age. The S and C lines were significantly different for the NEF/NES, NEH/NES percentages for days 2-15 and 2-8 after AI. The hatchability rate calculated as the ratio NEH/NEF was a little higher in the C line than in the S line for days 2-15 after AI, and it was also higher but statistically the same for days 2-8 after AI. Especially at G12, due to the effect of an abnormal operation of the incubator, there is a significant apparent age effect on NEH/NEF % in the S line, which was larger at 36-42 weeks of age than at 26-32 weeks of age in the S line (73.0% versus 60.62%). There was also a larger NEH/NEF % value at 36-42 weeks of age than at 26-32 weeks of age in the C line (73.06% versus 69.26%), but the difference was not significant.
Table 5. Mean ± standard deviation of fertility and hatchability rates for days 2-15 or days 2-8 after a single AI for S and C lines in G12 at 26-32 weeks of age (pooled semen)
| Days 2-15 after AI | Days 2-8 after AI | Line | Fertility rate | Hatchability rates | Fertility rate | Hatchability rates | | NEF/NES% | NEH/NES% | NEH/NEF% | NEF/NES% | NEH/NES% | NEH/NEF% | S | 59.98 a
±4.00 | 36.24 a
±3.92 | 60.43 a
±3.99 | 89.14 a
±2.50 | 54.03 a
±4.07 | 60.62
a ±3.99 | C | 33.80b
±5.19 | 23.60 b
±4.66 | 69.80 a
±5.04 | 61.46 b
±5.34 | 42.57 b
±5.43 | 69.26 a
±5.06 |
1NES = number of eggs set ; NEF = number of fertile eggs at candling (7th day of incubation); NEH = number of hatched mule ducklings.
Two different subscripts (a,b) in a column indicate significant differences (P < 0.05)
Table 6. Mean ± standard deviation of fertility and hatchability rates for days 2-15 or days 2-8 after a single AI for S and C lines in G12 at 36-42 weeks of age (individual semen)
| Days 2-15 after AI | Days 2-8 after AI | Line | Fertility rate | Hatchability rates | Fertility rate | Hatchability rates | | NEF/NES% | NEH/NES% | NEH/NEF% | NEF/NES% | NEH/NES% | NEH/NEF% | S | 58.15 a
±4.02 | 42.31 a
±4.03 | 72.60 a
±3.64 | 88.88 a
±2.57 | 64.92 a
±3.90 | 73.00
a ±3.62 | C | 32.72b
±5.15 | 23.91 b
±4.68 | 73.07 a
±4.87 | 62.26 b
±5.32 | 45.49 b
±5.47 | 73.06 a
±4.87 |
1NES = number of eggs set ; NEF = number of fertile eggs at candling (7th day of incubation) ; NEH = number of hatched mule ducklings.
Two different subscripts (a,b) in a column indicate significant differences (P < 0.05)
From our result, we confirmed that the selection plan had reached the goal to breed a line of ducks that can be inseminated once a week. The fertility rate of the duck was increased and the embryo viability was not impaired.
THE PARAMETER
τ
OF THE LOGISTIC CURVES Figure 7 shows the evolution of τ, time in days of half maximal fertility, across the generations of selection, of selected (S) and control (C) Brown Tsaiya duck lines and S-C differences. The S-C differences were significant from G3 on. It increased up to 4.26 days in G12 (10.75 d. and 6.49 d. for S and C lines, respectively) showing a positive selection response.
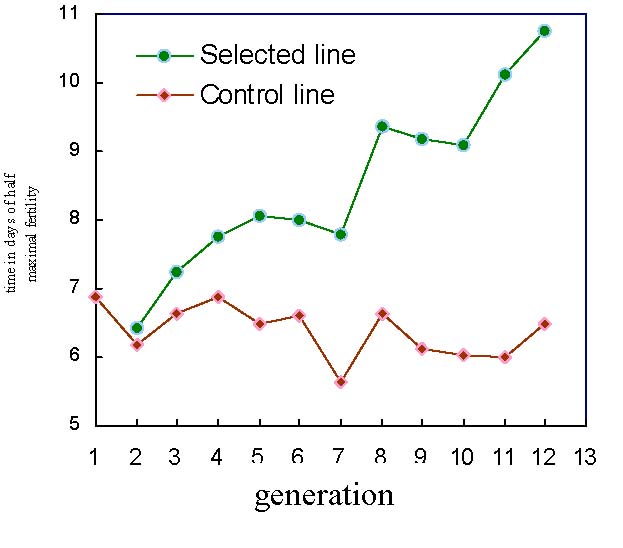 Figure 7. Evolution of τ, time in days of half maximal fertility, across the generations of selection, in the selected (S) and control (C) Brown Tsaiya duck lines
|
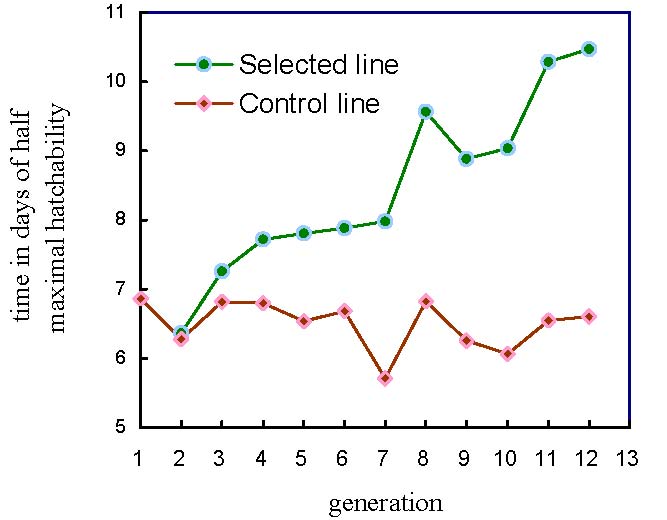 Figure 8. | Evolution of τ, time in days of half maximal hatchability according to eggs set, across the generations of selection, in the selected (S) and control (C) Brown Tsaiya duck lines
|
Figure 8 shows the evolution of τ, the time of half maximal hatchability. The S-C differences were also significant from G3 on. They increased up to 3.86 days (10.47 d. and 6.61 d. for S and C lines, respectively) showing a positive correlated selection response.
Figure 9 shows the adjusted logistic curves and the durations of fertility according to egg set rates from 1992 to 2005 (G1 to G12) for the S line and in 2005 for the C line. The R2 were >0.99 indicating the goodness of fit. In the S line, fertility rates were 91% at d2, and greater than 80% from d3 to d8. They began to decrease at d9 (75%), d10 (58%) to 3% at d15 (Table 7). On the contrary to the C line, the fertility rates, which were 85% at d2, showed an abrupt decrease from d4 (74%), at d5 (69%), d6 (52%), d7 (36%), d8 (26%), d10 (8%) and 0.5% at d15. A similar pattern was observed for hatchability rates (Table 8).
 Figure 9. Duration of fertility after single artificial insemination (AI) with pooled Muscovy semen of selected (1992-2005) and control (2005□) Brown Tsaiya lines. Solid lines for 2005 represent the functions of logistic curves
y(x)=91.90/1+e-0.7874(10.745-x) for the selected line and
y(x)=91.25/1+e-0.6797(6.489-x) for the control line.
Table 7. | Fertility rates (%) in selected (S) and control (C) Brown Tsaiya duck lines of G11 and G12, as a function of the number of days following a single artificial insemination (AI), and values of Student-Fisher t (1)
| Generation | Duck Line | No. of ducks | Number of days following the AI. | 2 | 3 | 4 | 5 | 6 | 7 | 8 | 9 | 10 | 11 | 12 | 13 | 14 | 15 | G11 | S | 226 | 90 | 92 | 94 | 91 | 91 | 87 | 79 | 65 | 50 | 29 | 17 | 9 | 3 | 1.1 | C | 227 | 78 | 77 | 70 | 58 | 40 | 27 | 13 | 10 | 4 | 2 | 0.8 | 0.3 | 0 | 0 | t(1) | 3.5 | 4.5 | 7 | 8.7 | 13.5 | 16.2 | 18.8 | 14.7 | 12.9 | 8.5 | 6.3 | G12 | S | 150 | 91 | 94 | 92 | 92 | 86 | 87 | 81 | 75 | 58 | 42 | 26 | 12 | 4 | 3 | C | 83 | 85 | 87 | 74 | 69 | 52 | 36 | 26 | 13 | 8 | 5 | 1.6 | 1.5 | 0 | 0.5 | t(1) | 1.3 | 1.7 | 3.4 | 4.2 | 5.5 | 8.6 | 9.5 | 12.1 | 10.0 | 7.9 | 6.4 | 3.5 | 2.5 | 1.6 |
Fertility rate (%):NEF/NES *100, ratio of number of fertile eggs (NEF) to the number of egg set (NES). NES per each day varied between 607-617(G11) and 432(G12) eggs in the S line, between 376-444(G11) and 226(G12) eggs in the C line.
(1) t : difference of fertility rates between S and C duck lines, divided by standard deviation of the difference. Not calculated when fertility rates are too small and normal distribution approximation cannot be done.
|
Table 8. | Hatchability rates (%) in selected (S) and control (C) Brown Tsaiya duck lines of G11 and G12, as a function of the number of days following a single artificial insemination(AI), and values of Student-Fisher t (1)
|
Generation | Duck Line | No. of ducks | Number of days following the AI. | 2 | 3 | 4 | 5 | 6 | 7 | 8 | 9 | 10 | 11 | 12 | 13 | 14 | 15 | G11 | S | 226 | 56 | 60 | 61 | 62 | 62 | 60 | 54 | 45 | 35 | 20 | 11 | 5 | 3 | 0.3 | C | 227 | 49 | 52 | 48 | 43 | 33 | 19 | 10 | 6 | 4 | 2 | 0.5 | 0 | 0 | 0 | t(1) | 1.5 | 1.7 | 2.8 | 4.1 | 6.5 | 9.8 | 11.4 | 10.6 | 9.0 | 6.4 | 4.9 | G12 | S | 150 | 53 | 60 | 59 | 61 | 56 | 48 | 41 | 44 | 35 | 27 | 16 | 7 | 2 | 1.2 | C | 83 | 59 | 58 | 54 | 48 | 38 | 26 | 15 | 9 | 7 | 5 | 1 | 2 | 0 | 0 | t(1) | -0.9 | 0.3 | 0.7 | 1.9 | 2.7 | 3.5 | 4.6 | 6.8 | 5.8 | 5.1 | 4.7 | 1.9 | 1.7 | 1.3 |
Hatchability rate (%):NEH/NES *100, ratio of number of hatched mule ducklings(NEH) to the number of egg set(NES).
(1) t : same as Table 7. |
Figure 10 shows the duration of hatchability rates of fertile eggs (NEH/NEF) in the selected (S) Brown Tsaiya duck line of generation 12, from d2 to d15 after single artificial insemination with pooled Muscovy semen. There was no evidence of increasing embryo mortality when the number of days after AI was increased. In the S line, the average hatchability (NEH/NEF) was 46-67% (26-32w) and 50-79% (36-42w). When comparing overall hatchability NEH/NEF between S and C lines across the 11 generations of selection, the values were statistically not different (data not shown). The overall values NEH/NEF for the 12 generations were 71.1% and 74.6% in the S and C lines respectively.
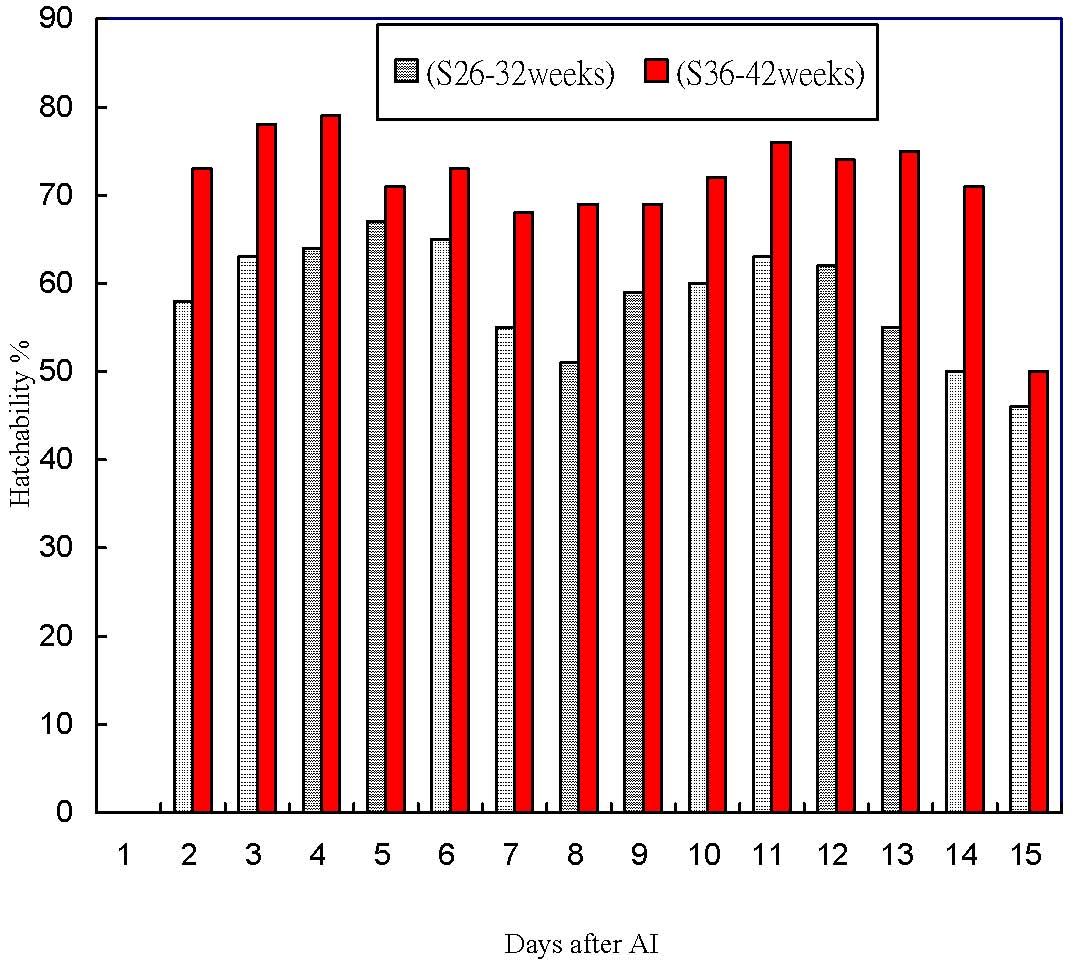 Figure 10. | The duration of hatchability (NEH/NEF%) from d2 to d15 after single artificial insemination (AI) with pooled Muscovy semen in the Brown Tsaiya line S (G12)
|
DISCUSSION The length of the fertile period in birds depends on the duration of sperm storage in the tubules at the utero-vaginal junction where the spermatozoa are released to be transported upwards towards the infundibulum for ova fertilization (Brillard, 1993). The purpose of this selection experiment was to investigate to what extent the genetic progress could be made on the fertile period of the Brown Tsaiya duck, and not to estimate the realized heritability of the selected trait. The selection was thus made with the BLUP of breeding values using an animal model. It was known that mixed model methodology has desirable properties, under certain conditions, when a selection model is involved, to adjust without bias for fixed effects, and to provide best linear unbiased predictors of random effects of the model (Henderson, 1975). Moreover, it was expected that the accuracy of the prediction of breeding values could be improved by comparison with the conventional combined selection index. Although the economic target was to increase the number of mule ducklings born after a single AI, it was decided to select the increased NEF and to study the direct and correlated responses to that selection. Tai et al. (1994) found an heritability value of 0.29, estimated from the sire variance component in 348 Brown Tsaiya female duck for the NEF which was expected to respond to selection. A control line is used to adjust the environmental trends, under the assumption that no genetic by environmental interaction was found when measuring the selection response. The selection responses were calculated, as usual, by taking the differences across the generations of selection between the average phenotypic values of S and C lines (Falconer and Mackay, 1996; Nicolas, 1980). Sorensen and Kennedy (1986) have indicated that an alternative way of estimating response to selection is to use the mixed model approach, since the phenotypic trend can be partitioned into its genetic and environmental trend. Therefore, we estimated the genetic trends by averaging in each generation the multiple-trait BLUP animal model values for each trait and established the differences between the S and C lines. These values are the predicted genetic responses.
The results indicate that the measured selection responses and the calculated predicted genetic responses were similar. This could indicate the adequacy of the data representation model and the accuracy of the genetic parameter estimates in the base population. The genetic progress in NEF measured by the selection response was significant, being in total 4.40 genetic standard deviation or 40% of genetic standard deviation per generation. The correlated responses in MD and NEH were also significant, being in total 4.89 and 3.56 genetic standard deviation respectively. The increase in NED was little more from G11 and the frequency of embryo mortality was not increased by selection. These results are consistent with the estimated genetic parameters, showing a high genetic correlations between NEF and MD (0.92), NEH (0.91) and between MD and NEH (0.82). In contrast with results obtained in the chicken hen (Beaumont et al., 1992; Beaumont, 1992), the selection on NEF seemed to be more effective in increasing NEH than the direct selection on that trait. This result can be explained by the fact that the heritability of NEF is greater than that of NEH (0.26 versus 0.19) and the genetic correlation between NEF and NEH being 0.91.
This study showed that the selection on NEF for 11 generations had correlatively major effects on parameter τ of the logistic curves which fitted the daily variations (d2-d15) in fertility rates (NEF/NES) or hatchability rates (NEH/NES). The S-C differences represented selection responses on the duration of fertility and hatchability which were correlated to the selection response on NEF. Selection on NEF changed the evolution of fertility and hatchability rates, as a function of time after a single AI of the Tsaiya duck with pooled Muscovy semen mainly by increasing the time of half maximal fertility and hatchability rates. The largest increases of the per day fertility rates after single AI were between d5 and d11. Selection on NEF also had correlated effects on the maximal value of fertility rates, but they were less important than the effect on the duration of fertility. Moreover, in the selected line, the fertility rate was higher than 80% from d2 to d8. The same tendencies were observed for the changes in the evolution of hatchability rates, showing that embryo viability was not impaired. Consequently, following Brillard et al. (1998) it can be suggested that selection on NEF acted by increasing the storage capacity of spermatozoa which remained able for a longer time to fertilize the ova. Besides, embryo viability was not damaged by the increase in the duration of fertility when selecting on NEF.
The overall fertility (NEF/NES) and hatchability (NEH/NES) rates in days 2-8 after AI were higher in the S line than in the C line. The embryonic viability rates measured by hatchability of fertile eggs (NEH/NEF) were statistically not different in the C line (73.1%) and in the S line (73.0%) for G12 (36-42 weeks of age), confirming the results in G8 and G11 (Cheng et al., 2002, 2005). The hatchability of fertile eggs (NEH/NEF) over the 11 generations of selection were also statistically not different in the S and C lines.
CONCLUSION On the basis of the results of Tai et al. (1994), a long term selection experiment on NEF with a selected and a control line was planned and began in 1992. The analysis of the selection experiment after 11 generations of selection showed that a selection response was obtained for NEF (3.83 eggs), with correlated genetic responses for increasing NEH (2.0 ducklings) and maximum duration of the fertile period (4 days), without increasing the embryo mortality rate. It showed that the selection to extend the fertile period was feasible (Cheng et al., 2002, 2005). The selection was effective in increasing the number of ova that could be fecundated after a single AI with pooled Muscovy semen, and consequently the number of eggs able to develop a viable embryo. Such changes had major effect on increasing the maximum duration of the fertile period, and the physiological effects need to be investigated. Correlatively, selection increased the fertility and hatchability rates according to eggs set, especially for days 2-8 after AI, showing that selection for one AI per week was possible in this strain of laying ducks. This did not increase the rate of embryonic death that could have impaired the benefits of selection as it was thought in fowl. Thus, in the intergeneric crossbreeding of ducks, ova fertilization seems to be a key point (Watanabe, 1961; Sellier et al., 2005). Nevertheless, the total mortality rate in relation to the number of fertile eggs was high (23 to 36% (G11)). Therefore, it would be useful to continue the selection experiment in order to study long term effects on fertility and embryo viability. In order to have a better understanding of how the selection was acting, the fertility rate curves (Kirby and Froman, 1990) according to the number of days after AI were compared in the S and C lines. In order to evaluate the possibilities of improving mule embryo viability in ducks, the genetic variability of viability should be estimated. The actual results might depend on the Brown Tsaiya used, which is a laying duck. Nonetheless, there open the way to select for an extension of the fertile period in meat-type duck such as Pekin duck, as the breed is being used effectively as parents for commercial mule ducks. Furthermore, research can now be focused on the detection of a quantitative trait locus of the duration of fertility and on how to improve the viability of the hybrid mule duck embryo.
ACKNOWLEDGMENTS This study was undertaken in 1992 and carried out as a cooperative research program between the Council of Agriculture - Livestock Research Institute (COA-LRI) and the Institut National de la Recherche Agronomique - Station d'Amélioration Génétique des Animaux du Département de Génétique Animale (INRA - SAGA). We would like to thank all the staff at LRI (especially Hsin-Hua Station of LRI) and INRA-SAGA for their help in carrying out this research, and also the National Science Council (NSC81-0409-B-061-504; NSC82-0409-B-061-016; NSC84-2321-B-061-004; NSC85-2321-B-061-002; NSC86-2321-B-061-005) and COA-LRI for their financial support.
REFERENCE Batut, M. C. 1996. Logiciel de gestion des Palmipèdes. Station d‘Amélioration Génétique des Animaux, INRA. France.
Beaumont, C. 1992. Genetic parameters of the duration of fertility in hens. Can. J. Anim. Sci. 72 :193-201.
Beaumont, C., J. P. Brillard, N. Millet, and M. De. Reviers. 1992. Comparison of various characteristics of duration of fertility in hens. Br. Poult. Sci. 33:649-661.
Brillard, J. P. 1993. Sperm storage and transport following natural mating and artificial insemination. Poult. Sci. 72: 923-928.
Brillard, J. P., C. Beaumont, and M. F. Scheller. 1998. Physiological responses of hens divergently selected on the number of chicks obtained from a single insemination. J. Reprod. Fertil. 114 :111-117.
Cheng, Y. S. 1995. Sélection de la race Tsaiya Brune sur la ponte et la durée de la fertilité en croisement avec le canard de Barbarie. Thèse. Institut National Polytechnique de Toulouse, France.
Cheng, Y. S., R. Rouvier, J. P. Poivey, and C. Tai. 1995. Genetic parameters of body weight, egg production and shell quality traits in the Brown Tsaiya laying ducks. Genet. Sel. Evol. 27 :459-472.
Cheng, Y. S., J. P. Poivey, R. Rouvier, and C. Tai. 1996. Prediction of genetic gains in body weight, egg production and shell quality traits in the Brown Tsaiya laying duck (Anas platyrhynchos). Genet. Sel. Evol. 28:443-455.
Cheng, Y. S., S. C. Huang, H. L. Liu, C. T. Wang, J. J. Liu Tai, C. Tai, R. Rouvier, and J. P. Poivey. 1999a. Selection experiment for the maximum duration of fertility in Brown Tsaiya female ducks bred by artificial insemination for mule duck production. Proceedings Symposium Scientific Cooperation in Agriculture between Institut National de la Recherche Agronomique (France) and Council of Agriculture (Taiwan,R.O.C.), Toulouse, April 19-20, pp.49-61, France.
Cheng, Y. S., H. C. Huang, H. L. Liu, J. J. Liu Tai, C. Tai, R. Rouvier, and J. P. Poivey. 1999b. Selection experiment for the maximum duration of fertility in Brown Tsaiya bred for mule duck: comparison for fertility, hatchability, embryo mortality rates in selected and control lines. Proceedings 1st World Waterfowl Conference Dec. 1-4, Taichung, Taiwan R.O.C. pp.115-121.
Cheng, Y. S., R. Rouvier, J. P. Poivey, S. C. Huang, and C. Tai. 2000. Response to selection on duration of fertility in Brown Tsaiya female duck bred for mule duck. Proceedings of the XXI World’s Poultry Congress 2000, August 20-25, pp. 202-205, Montreal, Quebec, Canada.
Cheng, Y. S., R. Rouvier, J. P. Poivey, J. J. L. Tai, C. Tai, and S. C. Huang. 2002. Selection responses for number of fertile eggs of Brown Tsaiya duck (Anas platyrhynchos) after a single artificial insemination with pooled Muscovy (Cairina moschata) semen. Genet. Sel. Evol. 34:597-611.
Cheng, Y. S., R. Rouvier, Y. H. Hu, J. J. L. Tai, and C. Tai. 2003. Breeding and genetics of waterfowl. World’s Poultry Science Journal Vol. 59:511-521.
Cheng, Y. S., R. Rouvier, J. P. Poivey, H. C. Huang, H. L. Liu, and C. Tai. 2005. Selection responses in duration of fertility and its consequences on hatchability in the intergeneric crossbreeding of ducks. British Poultry Sci. 46:565-571.
Falconer, D. S. and T. F. C. Mackay. 1996. Introduction to quantitative genetics. Fourth Edition, Longman Group Ltd., pp. 210-211.
Groeneveld, E. 1990. PEST User’s manual. Department of Animal Sciences, University of Illinois, Urbana, IL. U.S.A.
Groeneveld, E. and M. Kovac. 1990. A generalized computing procedure for setting up and solving mixed linear models. J. Dairy Sci. 73:513-531.
Henderson, C. R. 1975. Best linear unbiased estimation and prediction under a selection model. Biometrics 31:423-447.
Hill, W. G. 1972a. Estimation of genetic change. I. General theory and design of control populations. Animal Breeding Abstracts 40:1-15.
Hill, W. G. 1972b. Estimation of genetic change. II. Experimental evaluation of control populations. Animal Breeding Abstracts 40: 193-213.
Hill, W. G. 1980. Design of quantitative genetics selection experiments. in: Robertson A. (Ed.), Selection Experiments in Laboratory and Domestic Animals, Commonwealth Agricultural Bureaux, Slough, UK, pp. 1-13.
Huang, H. H. and T. C. Chow. 1974. Artificial insemination in mule duck production. in: Proceedings XV World Poultry Congress, New Orleans, 13 August, Louisiana, U.S.A., pp. 261-262.
Kirby, J. D. and D. P. Froman. 1990. Analysis of poultry fertility data. Poult. Sci. 69:1764-1768.
Liu, J. J., C. Tai, and H. H. Huang. 1980. Studies on artificial insemination of ducks. II. Effects of sperm number and sperm concentration on fertility. J. Chin. Soc. Anim. Sci. 9:71-77.
Matheron, G. and C. Chevalet. 1977. Conduite d'une population témoin de lapins. Evolution à court terme du coefficient de consanguinité selon le schéma d'accouplement. Ann. Génét. Sél. Anim. 9:1-13.
Nicholas, F. W. 1980. Size of population required for artificial selection. Genet. Res. Camb. 35:85-105.
Pingel, H. 1990. Genetics of egg production and reproduction in waterfowl. in: Crawford R.D., (Ed.), Poultry Breeding and Genetics. Elsevier, Amsterdam, Netherlands, pp.771-780.
Pingel, H. and C. H. Planert. 1987. Untersuchung über die möglichkeiten der verlangerung der befruchtungspersistenz. in: Proceedings 16th World’s Poultry Congress, Rio de Janeiro, 2:116-125.
Poivey, J. P. 1986. Méthode simplifiée de calcul des valeurs génétiques des femelles tenant compte de toutes les parentés. Genet. Sel. Evol. 18:321-332.
Poivey, J. P., Y. S. Cheng, R. Rouvier, C. Tai, C. T. Wang, and H. L. Liu. 2001. Genetic parameters of reproductive traits in Brown Tsaiya ducks artificially inseminated with semen from Muscovy drakes. Poult. Sci. 80:703-709.
Rouvier, R., L. J. J. Tai, and C. Tai. 1984. L'insémination artificielle des canes communes pour la production de mulards à Taïwan. La situation actuelle. in: Insémination artificielle et amélioration génétiques : bilan et perspectives critiques, Toulouse-Auzeville, France, 22-24 Novembre, Les Colloques de l'INRA, n 29, pp. 360-367.
Rouvier, R., R. Babilé, F. Salzmann, A. Auvergne, and B. Poujardieu. 1987. Répétabilité de la fertilité des canes Rouen et Pékin (Anas platyrhynchos) en croisement interspécifique avec le Barbarie (Cairina moschata) par insémination artificielle. Genet. Sel. Evol. 19:103-112.
Rouvier, R., M. M. Mialon, F. Salzmann, and B. Poujardieu. 1988. Fertilité et éclosabilité des oeufs d'une souche de cane Pékin (Anas platyrhynchos) en croisement interspécifique avec le Barbarie (Cairina moschata) par insémination artificielle. Ann. Zootech. 37:73-86.
Sellier, N., J. M. Brun, M. M. Richard, F. Batellier, V. Dupuy, and J. P. Brillard. 2005. Comparison of fertility and embryo mortality following artificial insemination of common duck females (Anas platyrhynchos) with semen from common or Muscovy (Cairina moschata) drakes. Theriogenology 64:429-439
SAS, 1996. User’s guide:Statistics, Release 6.03, SAS Institute Inc. Cary. NC. U.S.A.
Sorensen, D. A. and B. W. Kennedy. 1986. Analysis of selection experiments using mixed model methodology. J. Anim. Sci. 63:245-258.
Tai, C. 1985. Duck breeding and artificial insemination in Taiwan. in: Farrell D. J. and Stapleton P., (Ed.), Duck Production Science and World Practice, University of New England, Armidale, Australia, pp. 193-203.
Tai, C., R. Rouvier, and J. P. Poivey. 1994. Heritabilities for duration of fertility traits in Brown Tsaiya female duck (Anas platyrhynchos) by artificial insemination with pooled Muscovy (Cairina moschata) semen. Br. Poult. Sci. 35 : 377-384.
Tai Liu J. J. and C. Tai. 1984. Studies on the artificial insemination of ducks. 3. A comparison of fertility for pooled semen and individual male semen in the crosses between Muscovy (Cairina Moschata) and Tsaiya ducks (Anas Platyrhynchos Var. Domestica). Taiwan Livestock Res. 17(1):85-89.
Tai, Liu. J. J. and C. Tai. 1991. Mule duck production in Taiwan. I. Artificial insemination of ducks. Food & Fertilizer Technology Center, extension bulletin No. 328, pp. 1-6.
Watanabe, M. 1961. Experimental studies on the artificial insemination of domestic ducks with special reference to the production of mule ducks. J. Fac. Fish. Anim. Husb. Hiroshima Univ. 3:439-478.
此文件提供者: shuYing - [評分 : 0.00 (0 票選) | 評分!]
|
|
|