ACCLIMATION TO HIGH AMBIENT TEMPERATURE IN GROWING PIGS: EFFECTS OF BREED AND TEMPERATURE LEVEL
D. Renaudeau*, E. Huc, M. Kerdoncuff, and J. L. Gourdine
Institut National de la Recherche Agronomique, Unité de Recherches Zootechniques 97170 Petit Bourg, Guadeloupe French West Indies, France
* Corresponding author e-mail: David.Renaudeau@antilles.inra.fr
ABSTRACT
The effects of temperature level (24, 28, 32, 36°C) and breed (Creole vs. Large White) on physiological responses during acclimation to heat stress were studied in 2 experiments on a total of 144 barrows. In the first experiment, Large White (LW) pigs were kept at 24°C for 10 days and thereafter at 24, 28, 32 or 36°C for 20 days. In the second experiment, LW and Creole (CR) pigs were kept at 24°C for 10 days and thereafter at 31°C for 20 days. In both experiments, the relative humidity was fixed at 80%. Rectal temperature (RT), cutaneous temperature (CT) and respiratory rate (RR) were used as criteria to characterize the acclimation response. This response was analyzed using a bilinear model. The threshold day (Td) which marked the beginning of the acclimation response was not affected by temperature level but the rate of RT decrease after Td (v2) increased at 36°C (-0.025 vs. -0.015 °C/°C on average at 28 and 32°C). In the second experiment, Td value for RT was 0.35 d lower in CR pigs but the increase of RT before Td (v1) and v2 value were not affected by breed (0.31 and -0.038°C/°C, respectively). In other words, the better heat tolerance in CR pigs was related to a reduced Td for the onset of acclimation response rather than to a change in the slope of thermoregulatory response after Td. In conclusion, this study showed that acclimation response to a chronic heat stress is influenced both by temperature level and genotype of the pigs.
KEY WORDS: Acclimation, Heat stress, Temperature level, Breed, Pig, Thermoregulation.
INTRODUCTION
The effect of high ambient temperature on pig performance is well documented in the literature. Increasing ambient temperature above the upper limit of thermoneutral zone (i.e., about 25°C for growing pigs) reduces average daily feed intake (ADFI) with negative consequences on growth rate. However, most of the studies dealing with the effect of high temperature on pig performance were performed on heat-acclimated animals. In general, ADFI significantly decreases within the first 24-h exposure to elevated temperature and thereafter remains constant or slightly increases over the period of thermal acclimation (Morrison and Mount, 1971; Giles, 1992). In addition, over the same time period, rectal temperature and respiratory rate increase within 24 h and decline thereafter over successive days of exposure. Little is known about the effect of breed and/or temperature level on acclimation to high ambient temperature. In the French West Indies, a local Caribbean breed (i.e., the Creole pig; CR) is known for its good adaptation to the harsh tropical environment. For this purpose, it was introduced in our experimental station to study the genetic variability of heat tolerance in pigs. The objectives of this work are to study thermal acclimation in growing pigs exposed to various high ambient temperature level and to show whether this acclimation response is influenced by level of temperature and/or breed type.
MATERIALS AND METHODS
A total of 144 barrows were used in 2 experiments conducted on replicates of 12 animals at the experimental facilities of INRA in Guadeloupe (F.W.I., 16° Latitude N., 61° Longitude W.). Within a replicate, pigs were housed in a climatic controlled room for 40 d including 10 d for adaptation and 30 d for the experiment. The experimental room was equipped with 12 individual metal-slatted pens (0.85 × 1.50 m). Each pen was equipped with a feed dispenser and a nipple drinker designed to avoid water spillage. During the adaptation period, ambient temperature and relative humidity were fixed at 24°C and 80%, respectively. In the first experiment, Large White (LW) pigs were kept at 24°C for 10 d and thereafter at 24, 28, 32 or 36°C for 20 d. In the second experiment, LW and Creole (CR) pigs were kept at 24°C for 10 d (d-10 to d-1) and thereafter at a constant temperature of 31°C for 20 d (d 1 to d 20). On d 0, the temperature gradually changed from 24 to 31°C within 4 h starting at 0800. The relative humidity (RH) was kept at 80% over the total experiment. The pigs were offered ad libitum a diet formulated with maize, wheat middlings, and soybean meal . All pigs were weighed before and after 24-h fasting period at the beginning and at the end of the experiment. An additional weight was determined without prior fasting on morning of d 0 before temperature increase. Every morning, feed refusals were manually collected between 0700 and 0800, weighed and sampled for DM determination. Rectal (RT) and cutaneous (CT) body temperatures and respiratory rate (RR) were measured 3 times daily (i.e., at 0700, 1200, and 1800) every 2 to 3 days.
According to Morrison and Mount (1971) and Giles (1992), the pig thermoregulatory response has a biphasic profile consisting of an initial hyperthermia within the first 24-h exposure to heat stress and a subsequent recovery period characterised by a gradual increase of body temperature. In order to make a clear distinction between the periods during which RT, CT or RR increased after the temperature increased from 24 to high ambient temperature (28, 32, and 36°C or 31°C, in Exp. 1 and 2., respectively) declined over time of exposure in hot conditions, we looked for a “threshold day”, i.e., the day which marked the beginning of the acclimation response, using a bilinear model (Figure 1):
Y (°C or bpm) = y0 + v1 d- r (v1-v2) ln(1 + exp((d-Td)/r) (model 1)
Where Y is the response variable (°C or bpm), y0 (°C or bpm) is the value of Y at d = 0, Td (d of exposure) is the threshold day, and v1 and v2 (°C/d or bpm/d) are the linear variations of Y before and after the threshold day, respectively. The parameters of the model were estimated using the NLIN procedure of SAS (SAS Inst., Inc., Cary, NC).

Figure 1. Responses profiles (Rectal temperature (RT), cutaneous temperature (CT), and respiratory rate (RR)) over the acclimation period at a high ambient temperature. From d –1, the RT, CT and RR responses are adjusted using the following non linear model: Y (°C or bpm) = y0 + v1 d-0.25 (v1-v2) ln(1 + exp((d-Td)/0.25)) where y0 (°C or bpm) is the value of Y at d = 0, Td (d of exposure) is the threshold day, and v1 and v2 (°C/d or bpm/d) are the linear variations of Y before and after Td, respectively.
RESULTS AND DISCUSSION
Actual temperature and relative humidity and their diurnal variations in the experimental room were in agreement with the objectives of the experiments. Because of health problems (rectal prolapse and leg weakness), 3 pigs in the second experiment were removed (two Creole and one Large White pigs). During the first experiment, average BW of LW pigs was 55.4 kg ; the corresponding values were 52.2 and 44.5 kg for LW and CR pigs, respectively.
The long term effects of exposure to heat stress on RT, CT, and RR responses according to the breed or the temperature level are presented in Table 1 for both experiments. According to the results of Morrison and Mount (1971) and Giles and Black (1991), the steady decline in RT (i.e., v2) over time of exposure to hot conditions (31, and 28, 32, and 36°C in Exp.1 and Exp. 2, respectively) supports the hypothesis of a long term acclimation to heat stress (Figures 2 and 3). As observed in the present study, the decline in the RR was also measured by Morrison and Mount (1971) and Giles and Black (1991) (Table 1). According to the latter authors, the reduced O2 consumption measured in their study would cause a reduction in respiratory rate. In addition, as observed for RT or for RR, CT also showed a slight decrease over time which maintained unchanged RT-CT gradient and, therefore, non evaporative heat transfer. Finally, the decline in RR and in CT with the period of thermal acclimation tends to suggest that the demand for body cooling is reduced. In consequence, these declines would be considered as a consequence rather than a cause of a long term acclimation to heat exposure.

Figure 2. Effect of temperature level on rectal temperature response profile over the acclimation period at high temperature in growing pigs. Dots are means of observations 12 observations per level of temperature, lines are curves fitted according to the model 1 (experiment 1).
In Exp. 1, the threshold day (i.e., Td) at which RT began to decrease when LW pigs were kept to hot conditions numerically increased with the temperature level although this effect was not significant (Table 1; Figure 2). The Td value for CT was not affected by temperature (0.72 d. on average) whereas the Td value for RR was delayed at 32 and 36°C than at 28°C (0.63 vs. 0.00; P < 0.05). The linear RT and CT rises before the Td (i.e., v1) significantly increased with the temperature level (P < 0.05). In addition, the rate of fall in RT after Td (i.e., v2) was significantly higher at 36°C than at 28 or 32°C (-0.025 vs. -0.015°C/d, P < 0.05). From our results, with regard to RT measurements, it can be suggested that the temperature level would not influence the onset of acclimation response (i.e., Td) but it would increase the rate of acclimation to high temperature.
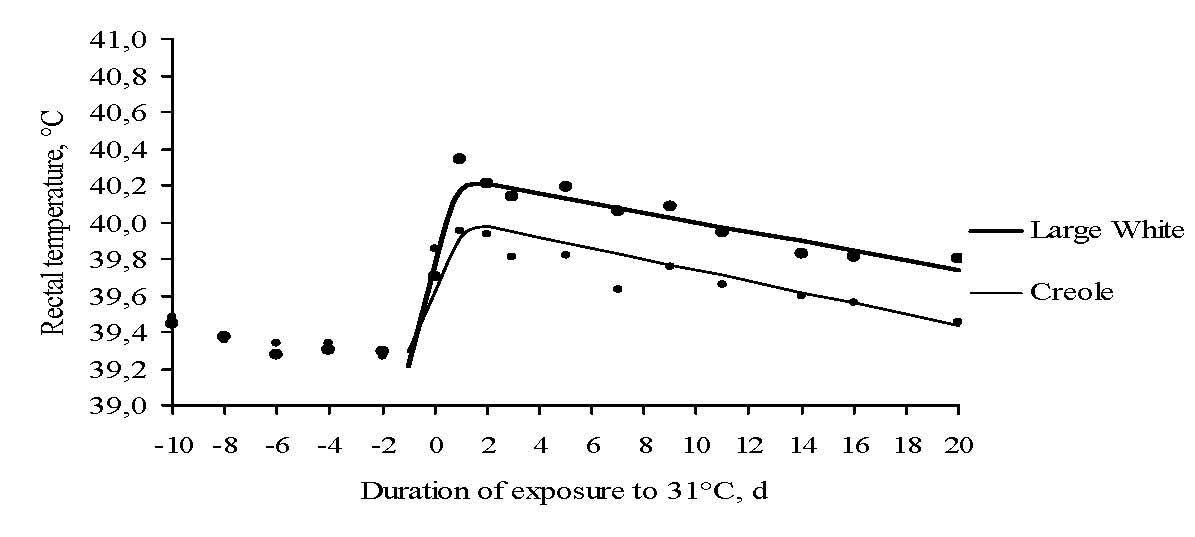
Figure 3. Effect of temperature level on rectal temperature response profile over the acclimation period at 31°C in growing pigs. Dots are means of observations 11 and 12 observations in Creole and Large White breed, lines are curves fitted according to the model 1 (experiment 2).
In contrast to other farm species (ruminants or poultry), the effect of breed on acclimation responses to high ambient temperature is poorly documented in pigs. In Exp. 2, threshold day value for RT was 0.35 d lower in CR than in LW pigs (0.81 vs. 1.16 d; P < 0.05). However, the increase of RT before threshold day and the rate of fall in RT between threshold day and d 20 were not affected by breed (P > 0.05; Table 1). On average, RT value was 0.3°C lower in CR than in LW pigs during the whole acclimation period at 31°C (P < 0.05; Figure 3). In fact, when the threshold duration of exposure to high temperature was reached, mechanisms involved in thermoregulatory response seemed to be identical for both breeds. To sum up, our results show that the lower RT in CR pigs was related to changes in the onset of time threshold rather than to changes in the slope of thermoregulatory response. According to the marked differences in ADG between CR and LW pigs (Renaudeau et al., 2006), it can be suggested that the effect of breed on heat acclimation responses could be related to differences in metabolic heat production.
To conclude, our results show an improved tolerance to heat stress with duration of exposure indicating an acclimation to heat. In addition this response is influenced by the temperature level. Finally, this study also demonstrates that physiological reactions during heat acclimation are affected by breed. However, further studies are needed to understand the mechanisms underlying the effect of breed on the onset of acclimation responses following an increase in ambient temperature.
ACKNOWLEDGMENTS
The authors gratefully acknowledge C. Anaïs, K. Benony, B. Bocage, M. Bructer, M. Giorgi, A. Racon, F. Silou, and J.L. Weisbecker for their technical assistance.
REFERENCE
Giles, L. R. and J. L. Black. 1991. Voluntary food intake in growing pigs at ambient temperatures above the zone of thermal comfort. In: E. S. Batterham (Ed.) Manipulating Pig Production III. pp. 162-166.
Giles, L. R. 1992. Energy expenditure of growing pigs at high ambient temperatures. Ph.D Department of Animal Science, University of Sydney, Australia. .
Morrison, S. R. and L. E. Mount. 1971. Adaptation of growing pigs to changes in environmental temperature. Anim. Prod. 13:51-57.
Renaudeau, D., M. Giorgi, F. Silou, and J. L. Weisbecker. 2006. Effect of breed (lean or fat pigs) and sex on performance and feeding behaviour of group housed growing pigs in a tropical climate. Asian-Aus. J. Anim. Sci. 19:593-601.
SAS. 1997. SAS/STAT User's Guide (version 7 4th Ed.). SAS Inst. Inc. cary, NC.


