Application of Genomic Livestock and Poultry for Animal Industry
Ming-Che Wu
Livestock Research Institute, Council of Agriculture
Hsinhua, Tainan 71210 Taiwan
Abstract
Genome mapping of farm animals has advanced greatly over the past few years. A number of QTL for meat production and major genes are now being identified. These genes and markers are being used by pig breeders and offer the hope of making real advancements in several economically important traits. Hal-1843 MS-PCR has been applied for removal of the halothane stress gene on chromosome 6 from breeding lines in order to reduce hog mortalities and improve meat quality in commercial herds since 1996. In dairy cattle, BLAD and DUMPS genetic marker tests had been requested for imported frozen semen from USA and others to have a better calving rate of those cows mated in spring since 1995. Goat meat production marker is focused on G6S for improvement of growth rate in 2002. Summer weather is harmful to meat type chicken and the desirable HSP gene allele is selected in chicken breeding populations to increase egg production in 2004. Future developments in genomics research and quantitative genetics will likely accelerate the discovery process of additional genes and their use of gene sequencing in marker assisted selection for economic traits of food animal.
Key Words: Genetic marker, Animal production, DNA test
Introduction
Pigs are often fed in confinement on small land holdings with small exercise yards, next to the owner’s household. After World War II, Taiwan’s successful small-scale farm development played various critical roles and laid the foundation for an economic miracle. Feed mills began producing formulated livestock feeds using mostly imported ingredients on a large scale at the end of the 1960s. The large swine farms, with thousands of sows used modern feed, formulated on farms with modern management and housing systems. During 1986 and 1996, Taiwan became a major exporter of pork to Japan. The main island of Taiwan is mountainous and afforested, with fertile, cultivated, well-watered and heavily populated lowlands to the west of the central mountain range with a total land area of 36,179 km2. The human population is 23.1 million. The climate is subtropical, with hot humid summers, mild winters and heavy rainfall. There is a continuous growing season for crops and agriculture prospers, in spite of typhoons, violent summer thunderstorms, and flooding, as well as prolonged winter droughts. About a quarter of the land is arable. Five percent of the land is meadow and pasture.
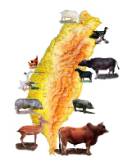
Livestock and poultry in Taiwan include pig, dairy cow, goat, horse, rabbit, chicken, duck, goose and turkey (Figure 1). Other major poultry raised by local farmers include quail and ostrich. Due to high land prices and rising environmental awareness, most local farmers operate on a small scale in rural areas of Central and Southern Taiwan. Coupled with import-dependent feeds and expensive laborers, the local livestock industry operates at a rather high production cost. Fortunately, local livestock farmers are highly diligent, and have advanced feeding and breeding skills.
 | 
| 
|  |  |  |
Buffalo | Cattle | Goat | Sika Deer | Sambar |
 |  |  |  |  |
Pig | Horse | Sheep | Rabbit | Duck |
Native breeds and conservation sites |  |  |  |  |  |
Chicken | Turkey | Goose | Swan | Muscovy |
Figure 1. Breed resources for animal industry in Taiwan.
In 2003, the number of pig farms totaled 13,154, raising a total of 6,778,799 pigs or 515 pigs per farm. The output value of pig farming in 2001, 2002 and 2003, reached NT$46.2 billion, NT$49.2 billion and NT$57.4 billion, respectively, topping the list of single agricultural product output value and accounting for 16.06% of the total agricultural production value in 2003. In 2003, dairy farms have reached a total number of 730, raising 132,263 cows, or 181 cows per farm, of which milk cow totaled 59,467, with the overall milk yield of 354,421 metric tons. This represents a self-sufficiency rate of 24.18% and an annual milk yield per cow of 5,960 kg. The industry's total output of the year 2003 amounted to NT$7.53 billion. The number of goat farms has totaled 698 as of the end of 2000, with the total goats of 112,554 or 161 goats per farm. The daily milk yield per goat was 1.7kg on average, and thus the annual production of goat's milk amounted to 30,006 metric tons with a self-efficiency rate of 58.1%. Meat goat farms totaled 4,317, raising 202,491 goats or 290 goats per farm. The goat farming industry had an annual production value of NT$2.4 billion. Meat type chicken industry concentrates on two types of broiler farmers: white feathered broilers and colored broilers. The annual output volume of white-feathered broilers is approximately 180 million, and that of colored broilers totals 175 million. Daily egg production ranges from 80,000 to 85,000 crates, each weighing 12kg and containing approximately 200 eggs. Domestic egg production is completely self-sufficient. Most layer farms are concentrated in the central and southern parts of Taiwan. Due to the advancement in production technology and the increase in market demand, poultry farming has rapid growth over the past two decades. The output value of the poultry industry in 2003 reached NT$43.1 billion, comprising of NT$24.9 billion worth of broilers, NT$11.2 billion of chicken eggs, NT$1.2 billion of duck eggs and NT$4.8 billion of duck and geese meat.
Molecular genomic analysis has revolutionized how geneticists and breeders evaluate the production differences that exist within the domesticated animals. In this case the DNA tested gene is known as a marker, because it marks a section of chromosome affecting performance. The gene whose presence it detects is known as a quantitative trait loci (QTL), with linkage between the marker and the QTL. The pig industry is actively using some of genome information to improve swine production by marker-assisted selection. Over the past decade tremendous progress has been made mapping and characterizing the swine genome. Currently, moderate to high-resolution genetic linkage maps containing highly polymorphic loci have been produced using independent mapping populations (Rohrer et al. 1996). To date, >5,000 mapped loci are cataloged for the pig genome (
http://www.thearkdb.org). Large scale sequencing of expressed sequences (ESTs) in conjunction with genomic sequencing has permitted the identification of single nucleotide polymorphisms (SNPs) that can be used to finely map economic traits, such as meat quality, growth rate and feed efficiency. Thus, the tools and information have been developed to permit application of genomics into improving the health and performance of pigs. Clearly, low cost diagnostics based on this information will be the next wave of development for livestock and poultry farming.
Pig genomics and industry applications
Present and future genetic improvements for the economically important traits in pigs will result from the more detailed genetic maps and our growing understanding of the function and structure of the individual genes. In the pig the DNA is distributed over 19 pairs of chromosomes and organized into some 100,000 functional genes (Visscher and Haley, 1998). It has been known for 10 years that pale soft and exudative (PSE) pork and PSS (Porcine Stress Syndrome) pigs are associated with variation in the Halothane gene (RYR1 or CRC1) on chromosome 6. The halothane RYR1 appears to be functional gene or QTL responsible for all the effects on lean growth and stress susceptibility. The estrogen receptor ESR on chromosome 1 is associated with litter size (Rothschild et al., 1996). H-FABP (Heart fatty acid binding protein) gene on chromosome 6 was discovered to affect intramuscular fat in Duroc pig (Gerbens et al, 1998). Candidate genes to control boar taint arising from skatole and androstenone were reported (Davis and Squires, 1999).
The exotic Duroc, Landrace, and Yorkshire are the most popular breeds for three-way cross hog production in Taiwan. Young Duroc, Yorkshire and Landrace boars with registered parent(s) were performance tested at the Taiwan Livestock Research Institute, COA started from the first test group of September 1989. There were 75 contemporary groups finishing the growth performance tests at the station by August 2004. There were 7,296 boars in attendance, with 89.8% completing the tests. The starting weight was set around 30 kg during 1989 to 1995, was then increased to 40 kg in accordance with the national hog cholera free project requirements. The end weight was set at 110 kg during all test periods. The average daily gain, feed efficiency and backfat thickness of boars in 1989 were ranged 0.837~0.873kg, 2.47~2.57 and 1.65~1.97cm, respectively. The above three traits were recorded and evaluated as a contemporary group deviation form for selection index calculation purposes. In 2004, average daily gain, feed efficiency and backfat thickness of boars has been improved to 1.002~1.104kg, 2.02~2.07 and 1.20~1.27cm, respectively (Table 1).
Table 1. Growth performance of halothane gene free boars of D, L, and Y breed in Taiwan
Yearof
Birth | Breed | No.of
Boar | Ageto 110kg, day | ADG,kg | FE(Feed/Gain) | BFThickness, cm | SelectionIndex |
Earliest | Mean | Greatest | Mean | Best | Mean | Thinnest | Mean | Highest | Mean |
2004 | D | 72 | 131 | 149.5 | 1.143 | 1.008 | 1.90 | 2.021 | 1.03 | 1.200 | 125 | 106.9 |
2003 | D | 208 | 125 | 148.7 | 1.250 | 1.040 | 1.90 | 2.061 | 1.02 | 1.224 | 125 | 106.7 |
2002 | D | 179 | 128 | 148.9 | 1.300 | 1.046 | 1.93 | 2.090 | 1.10 | 1.276 | 134 | 108.4 |
2001 | D | 228 | 126 | 150.2 | 1.208 | 1.017 | 1.93 | 2.123 | 1.08 | 1.304 | 128 | 106.9 |
2000 | D | 208 | 123 | 156.2 | 1.382 | 1.020 | 1.95 | 2.117 | 1.04 | 1.370 | 128 | 105.9 |
2004 | L | 34 | 127 | 145.6 | 1.339 | 1.104 | 1.92 | 2.021 | 1.04 | 1.233 | 143 | 111.1 |
2003 | L | 155 | 120 | 141.7 | 1.492 | 1.134 | 1.73 | 2.061 | 1.01 | 1.224 | 167 | 115.6 |
2002 | L | 109 | 120 | 144.4 | 1.461 | 1.104 | 1.88 | 2.086 | 1.05 | 1.296 | 162 | 117.3 |
2001 | L | 82 | 126 | 142.6 | 1.471 | 1.105 | 1.94 | 2.116 | 1.10 | 1.288 | 158 | 117.7 |
2000 | L | 125 | 120 | 149.0 | 1.357 | 1.082 | 1.94 | 2.091 | 1.08 | 1.349 | 150 | 113.8 |
2004 | Y | 14 | 142 | 155.1 | 1.135 | 1.002 | 1.96 | 2.071 | 1.16 | 1.279 | 128 | 111.6 |
2003 | Y | 34 | 141 | 154.7 | 1.190 | 1.053 | 1.96 | 2.079 | 1.14 | 1.293 | 129 | 109.9 |
2002 | Y | 19 | 137 | 149.4 | 1.167 | 1.065 | 1.98 | 2.113 | 1.17 | 1.349 | 125 | 114.5 |
2001 | Y | 29 | 140 | 152.2 | 1.286 | 1.066 | 1.98 | 2.103 | 1.21 | 1.359 | 138 | 112.6 |
2000 | Y | 36 | 126 | 152.3 | 1.357 | 1.063 | 1.95 | 2.095 | 1.17 | 1.372 | 152 | 115.3 |
Selection Index for L and Y = 100 + 130 (ADG-MADG) - 40(FE-MFE) - 40(BF-MBF)
Selection Index for D = 100 + 60 (ADG-MADG) - 40(FE-MFE) - 45(BF-MBF)
All original data and evaluated results were stored in an internet-based database. The performance tested data and related information can be easily accessed from the web site (
http://www.angrin.tlri.gov.tw). The economically important traits such as PSS genotype, lineage information such as registration information, and tested parental performance can be accessed recursively through the web. Removal of the Halothane stress gene from breeding lines using the halothane test in 1988 and the MS-PCR DNA marker test in 1996 reduced mortalities of hogs and improved meat quality in fresh pork. In 1996, halothane gene free boars reached 74.2%, 90.0%, and 60.2% in L, Y, and D breed, respectively. The minimum ages of the tested boars at 110 kg body weight were 120, 126 and 123 days of age in Landrace (200101 tested group), Yorkshire (200103 tested group) and Duroc (200101 tested group), respectively. The highest feed efficiency in term of feed conversion ratios (Feed/Gain) from 40 to 110 kg body weight were 1.73, 1.95 and 1.90 in Landrace (200307 tested group), Yorkshire (200007 tested group) and Duroc (200311 tested group), respectively.
Currently, methods for pig breeding in Taiwan are the combination of methods between index selection and genetic marker assisted selection. PSS, ESR, and H-FABP genetic markers have been applied at the growth performance test station for boars. For those of boars born after 2003, the frequency of ESR B allele (desirable allele) in 190 L, 48 Y, and 282 D boars were 6.1%, 50.0%, and 0.9%, respectively. Rothschild et al. (1996) estimated that the B allelic effect varied from 1.15 piglet per litter in Meishan pig to 0.42 piglets per litter in Yorkshire. Therefore, the relevance of results found in LY crosses involving the L and Y breeds will have to be evaluated in commercial lines. There has been an increase in the rate of genetic response by incorporating the ESR genotype in selection indices for sow lines in nucleus herds. Furthermore, the increase in average litter size is observed in crossbred products derived from these lines. Litter performances of Duroc, Landrace, and Yorkshire sows in lineage populations with registration certificate were presented in Table 2. Number of piglets born alive in Landrace and Duroc sows had a significantly increase in 1999. Such results might due to the application of Hal-1843 nucleotide mutation test to free PSS of each registered sow. To date, almost 100% of Landrace and Yorkshire sows in nucleus herds have PSS-gene free, but only 30% free in Duroc sows.
Genetic makeup of pigs can have a significant influence on meat quality. Two of the main genes that can affect ultimate meat quality, are the halothane (stress) gene and the Napole (RN-) gene. Fresh meat color has a subtle but important impact on consumer purchase decisions. Most consumers prefer a bright reddish-pink color in fresh pork. Intramuscular fat or marbling has been related to meat eating quality which is defined as flavor, juiciness and/or tenderness of meat. Pork with a higher amount of intramuscular fat would be expected to produce meat with more desirable and less variable eating quality than the meat with less intramuscular fat. However, some consumers prefer pork containing little or no marbling, in order to avoid the associated calories.
Table 2. Number of live piglets at birth per litter in Duroc, Landrace, and Yorkshire breed
Year | Duroc | Landrace | Yorkshire |
Litters | Max. | Average | SD | Litters | Max. | Average | SD | Litters | Max. | Average | SD |
1992 | 5291 | 19 | 8.18 | 2.65 | 8283 | 18 | 8.91 | 2.76 | 2802 | 18 | 8.77 | 2.85 |
1993 | 5119 | 17 | 8.25 | 2.66 | 7744 | 18 | 9.02 | 2.76 | 2717 | 18 | 8.79 | 2.85 |
1994 | 5379 | 17 | 8.46 | 2.67 | 8453 | 21 | 9.11 | 2.74 | 3088 | 19 | 8.92 | 2.92 |
1995 | 4943 | 17 | 8.54 | 2.69 | 8554 | 19 | 9.04 | 2.84 | 3313 | 18 | 8.70 | 3.13 |
1996 | 5251 | 17 | 8.57 | 2.60 | 9126 | 19 | 9.28 | 2.82 | 3817 | 18 | 8.94 | 3.05 |
1997 | 3801 | 17 | 8.43 | 2.42 | 6707 | 19 | 9.44 | 2.41 | 2842 | 22 | 9.16 | 2.89 |
1998 | 3083 | 15 | 8.32 | 2.64 | 5139 | 17 | 8.88 | 3.32 | 1746 | 20 | 9.14 | 2.54 |
1999 | 3277 | 17 | 8.80 | 2.30 | 5772 | 18 | 9.93 | 2.36 | 1542 | 18 | 9.17 | 2.53 |
2000 | 3852 | 18 | 8.89 | 2.39 | 6389 | 19 | 9.88 | 2.47 | 1728 | 18 | 8.95 | 2.57 |
2001 | 4159 | 21 | 8.86 | 2.49 | 6168 | 20 | 9.82 | 2.50 | 1463 | 18 | 8.78 | 2.59 |
2002 | 3602 | 19 | 8.90 | 2.66 | 5879 | 20 | 9.87 | 2.55 | 1303 | 17 | 8.73 | 2.76 |
2003 | 3427 | 18 | 9.32 | 2.42 | 5718 | 20 | 10.20 | 2.50 | 1275 | 19 | 8.99 | 2.59 |
2004 | 1292 | 15 | 9.53 | 2.25 | 1992 | 19 | 10.46 | 2.43 | 393 | 19 | 9.00 | 2.45 |
Note: In 2004, litter records were reported from Jan to Jun.
H-FABP gene with three nucleotide mutations (defined as H, a, and d alleles) maps to chromosome 6 and found them to be associated with variation in intramuscular fat in the Duroc breed (Gerbens et al., 1998) and not to the QTL regions on chromosomes 4 and 7 identified by De Koning et al. (1998). Three desirable alleles of H, a, and d in H-FABP gene were detected by genotyping and produced possible 27 combinations of their genotypes in Table 3. According to the amount of desirable alleles, we redefined various combinations into seven groups HH6 (Hhaadd, with 6 desirable alleles in total), HL5, HL4, HL3, LL2, LL1 and LL0 (hhAADD, with zero desirable allele). Frequency of HH6 in the Duroc registered boars born after 2003 in the performance test station was 61.7% (174/282), but zero percentage in L and Y breeds (Table 4). Most of H-FABP genotype codes were HL4 (62.1%) in L and LL1 (35.4%) in Y boars.
The pig industry will continue to compete on the low cost per kilo of lean meat. In today, the pig industry arguably some 20-30% of genetic potential is not realized on the small scale farms due to poor herd health, poor husbandry, and incomplete application of the nutritional needs of the modern improved genotype. The breeding companies will be integrators of a range of advanced technologies, providing a package of genetic services to the food chain.
Table 3. Seven codes defined for 27 combinations of three allelic mutation genotypes of heart fatty acid binding protein gene in pigs
| | aa | Aa | AA | |
HH | HH6 | HL5 | HL4 | dd |
HL5 | HL4 | HL3 | Dd |
HL4 | HL3 | LL2 | DD |
Hh | HL5 | HL4 | HL3 | dd |
HL4 | HL3 | LL2 | Dd |
HL3 | LL2 | LL1 | DD |
hh | HL4 | HL3 | LL2 | dd |
HL3 | LL2 | LL1 | Dd |
LL2 | LL1 | LL0 | DD |
Table 4. Genotype frequency of seven codes of H-FABP gene in D, L, and Y boars
Breed | No.of Boars | HH6 | HL5 | HL4 | HL3 | LL2 | LL1 | LL0 |
D | 282 | 61.7% (174) | 0.7% ( 2) | 12.4% (35) | 21.3% (60) | 0.0% ( 0) | 1.4% ( 4) | 2.5% ( 7) |
L | 190 | 2. 0% ( 0) | 2. 6% ( 3) | 62.1% (118) | 10.5% (20) | 24.2% (46) | 2. 5% ( 1) | 2. 1% ( 2) |
Y | 48 | 2. 0% ( 0) | 2. 0% ( 0) | 10.4% ( 5) | 25.0% (12) | 27.1% (13) | 35.4% (17) | 2.1% ( 1) |
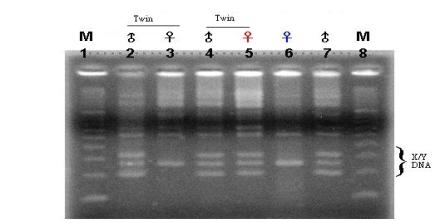
Figure 2. Sex-linked gene test for freemartin in dairy cow: lane 5 calf is freemartin calf in twin births but lane 3 calf is a normal calf from twin births.
In Taiwan, somatic cell counts of milk had been implemented into the dairy herd improvement (DHI) evaluations since 1998 due to mastitis causing the greatest economic loss in the dairy industry about NT$0.6 billion per year. An elite cow selection schemes initiated from 2001 based upon DHI database (Table 5) to identify milk cows with less somatic cell counts along with higher milk yield and milk protein content (Table 6). Then, elite cows were tested for the genotypes on bovine leukocyte adhesion deficiency (BLAD), deficiency of uridine monophosphate synthase (DUMPS), and citrullinemia (Citr). Elite cow populations will have normal pregnancy and calving with a higher productive herd life after free from BLAD, DUMPS and Citr genetic defects.
Table 5. Milk production and quality of elite cows in DHI herds
Year | Farms | Milkcows per farm | Dailymilk yield, kg | Fat% | Protein% | Lactose% | Totalsolid % | Somaticcell counts, x104/mL |
2004 | 334 | 74 | 22.12 | 3.78 | 3.20 | 4.77 | 12.45 | 30.96 |
2003 | 348 | 73 | 22.02 | 3.76 | 3.22 | 4.80 | 12.48 | 35.41 |
2002 | 315 | 70 | 21.77 | 3.73 | 3.22 | 4.78 | 12.42 | 35.39 |
2001 | 287 | 65 | 21.46 | 3.72 | 3.20 | 4.69 | 12.32 | 36.52 |
Marker-assisted selection schemes that utilize information about quantitative trait loci to pre-select progeny test bulls within a family are the most practical application of QTL results in the short-term (Spelman and Garrick, 1998). In the dairy cattle the DNA is distributed over 30 pairs of chromosomes. Heyen et al. (1999) conducted a genome scan for QTL influencing milk production and health traits by using 174 genotyped markers. No effects reaching genomewide or suggestive significance thresholds were found for somatic cell counts, an indicator trait for mastitis resistance, but putative QTL were identified on chromosome 5, 7, 21, 22, 23 and 26.
Table 6. Milk performance of elite cows from 2001 to 2003.
Test period Item | 200107 Summer (Feb~Jul) | 200207 Summer (Feb~Jul) | 200307 Summer (Feb~Jul) |
No.of farms | 269 | 289 | 314 |
305-2X-MEmilk yield mean, kg | 6405 | 6813 | 6991 |
1.Enrollment rate (No. of six month-tested cows / Total) | 23.8% (4640/ 19508) | 23.0% (5712/ 24844) | 16.4% (4731/ 28807) |
2.Percentage of cows with 305-2X-ME milk yield mean greater than 9000 kg | 6.3% (291/4640) | 10.9% (623/5712) | 13.4% (632/4731) |
3.Percentage of cows with 305-2X-ME milk yield EBV greater than +700 kg | 10.6% (492/4640) | 11.1% (635/5712) | 12.3% (581/4731) |
4.Percentage of cows with somatic cell counts less than 100,000 cells/mL | 37.5% (1740/4640) | 35.4% (2021/5712) | 36.6% (1731/4731) |
5.Percentage of cows with protein % greater than 3.5% | 24.1% (1117/4640) | 23.4% (1334/5712) | 26.7% (1262/4731) |
6.Percentage of cows with somatic cell counts less than 300,000 cells/mL | 69.1% (3202/4640) | 66.9% (3824/5712) | 68.8% (3255/4731) |
7.Percentage of cows with protein % greater than 3.2% | 59.5% (2761/4640) | 58.8% (3356/5712) | 61.7% (2920/4731) |
No. of cows having traits of item 1to 5 | 7 | 12 | 14 |
No. of cows having traits of item 1to 3 and item 6 to 7 | 76 | 131 | 132 |
Mean and standard deviation of305-2X-ME milk yield, kg | 9669+638 | 9857+770 | 9844+733 |
Mean and standard deviation of305-2X-ME milk yield EBV, kg | 921+199 | 907+200 | 919+209 |
Mean and standard deviation ofsomatic cell counts in cows with less than 100,000 cells/mL, x104cells/mL | 5.3+2.4 | 5.5+2.3 | 5.6+2.3 |
Mean and standard deviation ofprotein % in cows with greater than 3.5%, % | 3.77+0.26 | 3.76+0.25 | 3.77+0.25 |
Mean and standard deviation ofsomatic cell counts in cows with less than 300,000 cells/mL, x104cells/mL | 11.1+7.6 | 11.3+7.5 | 11.3+7.4 |
Mean and standard deviation ofprotein % in cows with greater than 3.2%, % | 3.51+0.28 | 3.50+0.26 | 3.53+0.28 |


 畜業領域遺傳資源之管理現況


